
Image
|
Figure Caption
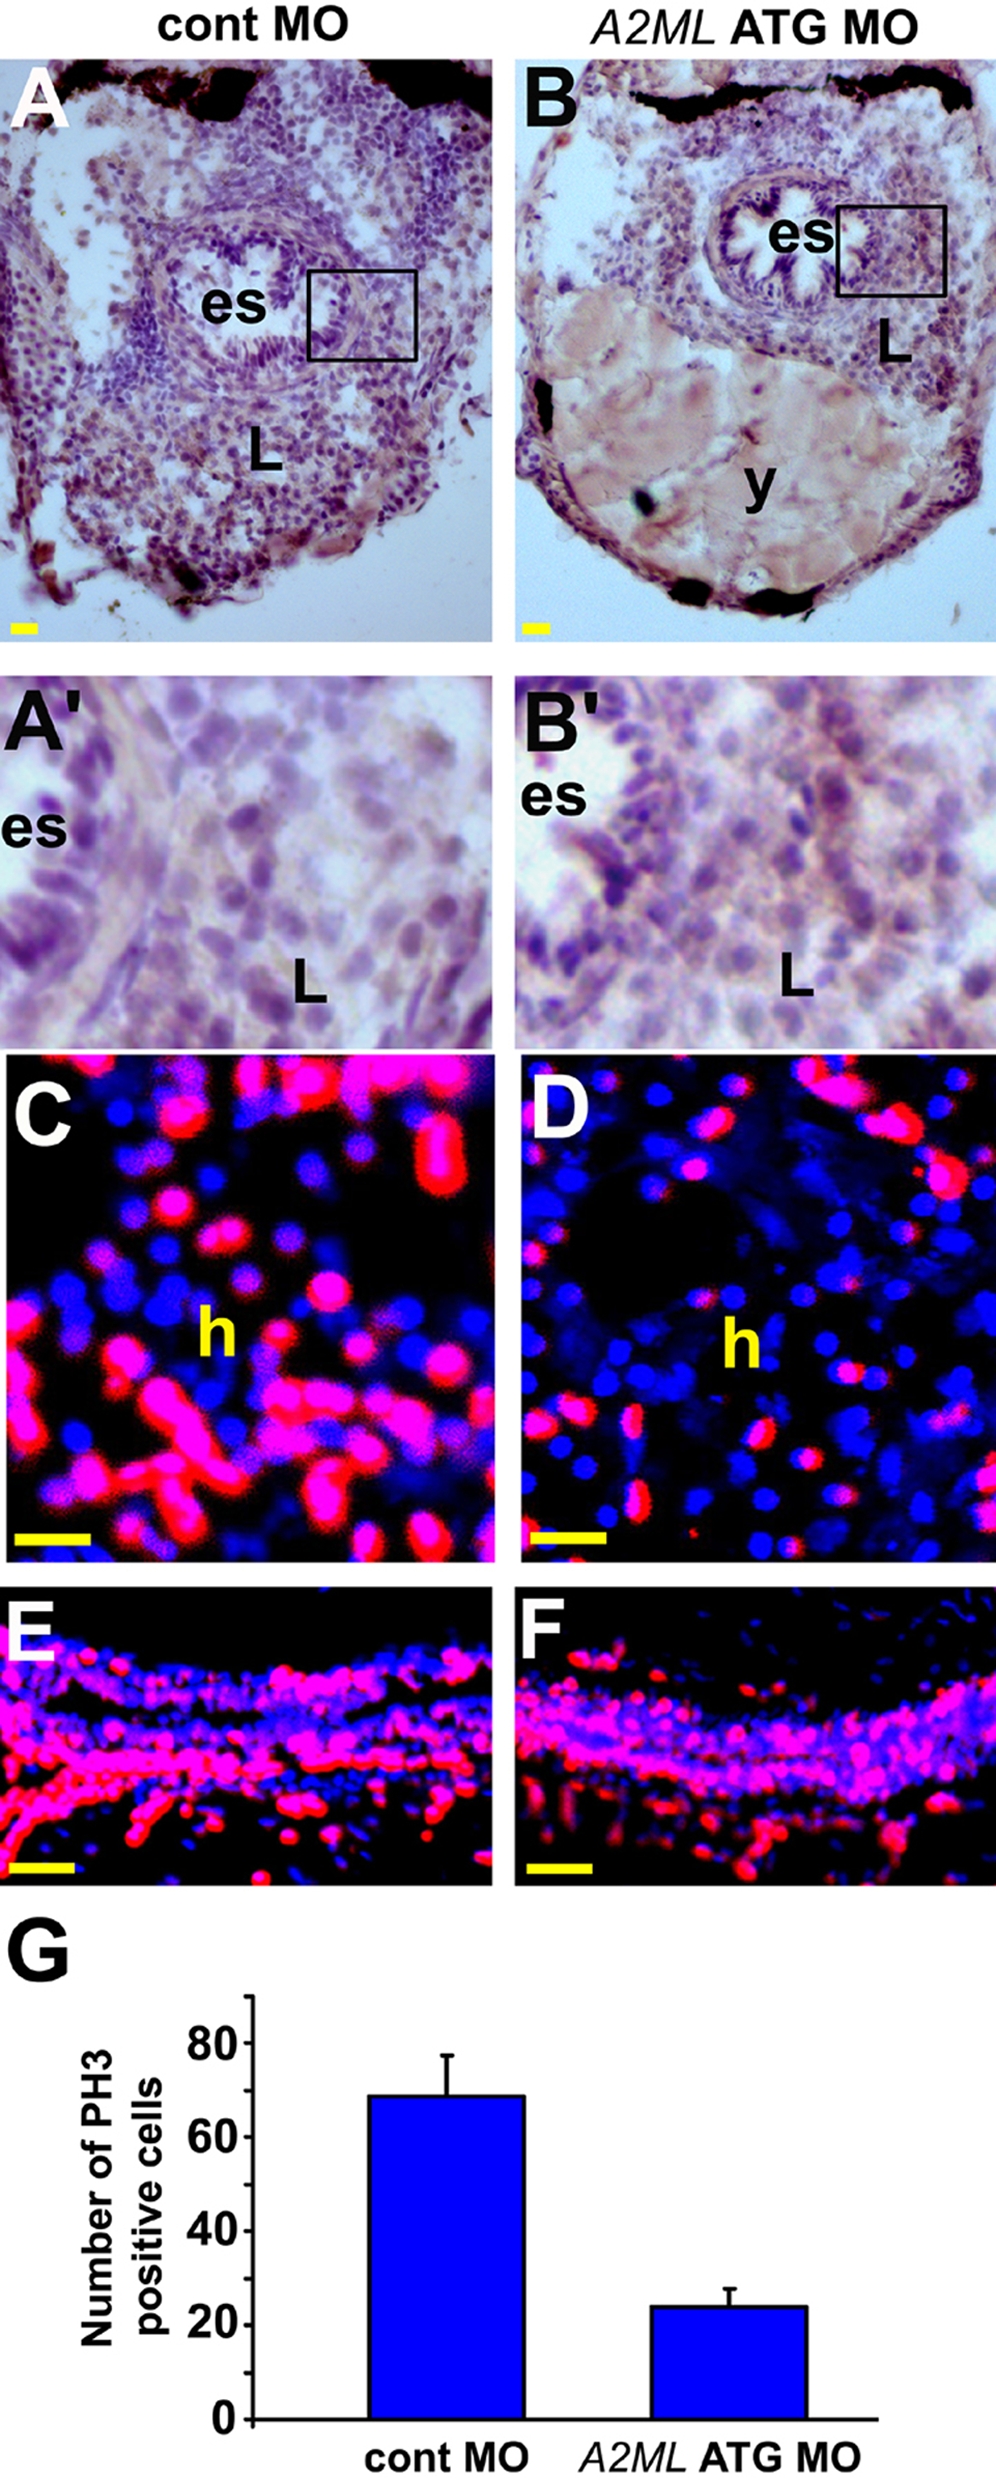
Fig. 6 TUNEL and PH3 staining in A2ML ATG MO-injected embryos.
All embryos were at 5 dpf. A–D are transverse section, and E–F sagital section. A–B′ TUNEL staining of cont MO-injected embryo (A), and knock-down embryo (B). Areas in open square in A and B are magnified in the A′ and B′. C–D Confocal images of sections stained with anti-PH3ser10 antibody. E–F PH3 staining in the intestine in cont MO (E) and in A2ML ATG MO-injected embryos (F). G Quantification of PH3-positive liver cells. Scale bars in (A and B) 20 μm, and in (C–F) 50 μm. es, esophagus; L, liver; y, yolk.
Figure Data
Acknowledgments
This image is the copyrighted work of the attributed author or publisher, and
ZFIN has permission only to display this image to its users.
Additional permissions should be obtained from the applicable author or publisher of the image.
Full text @ PLoS One