
|
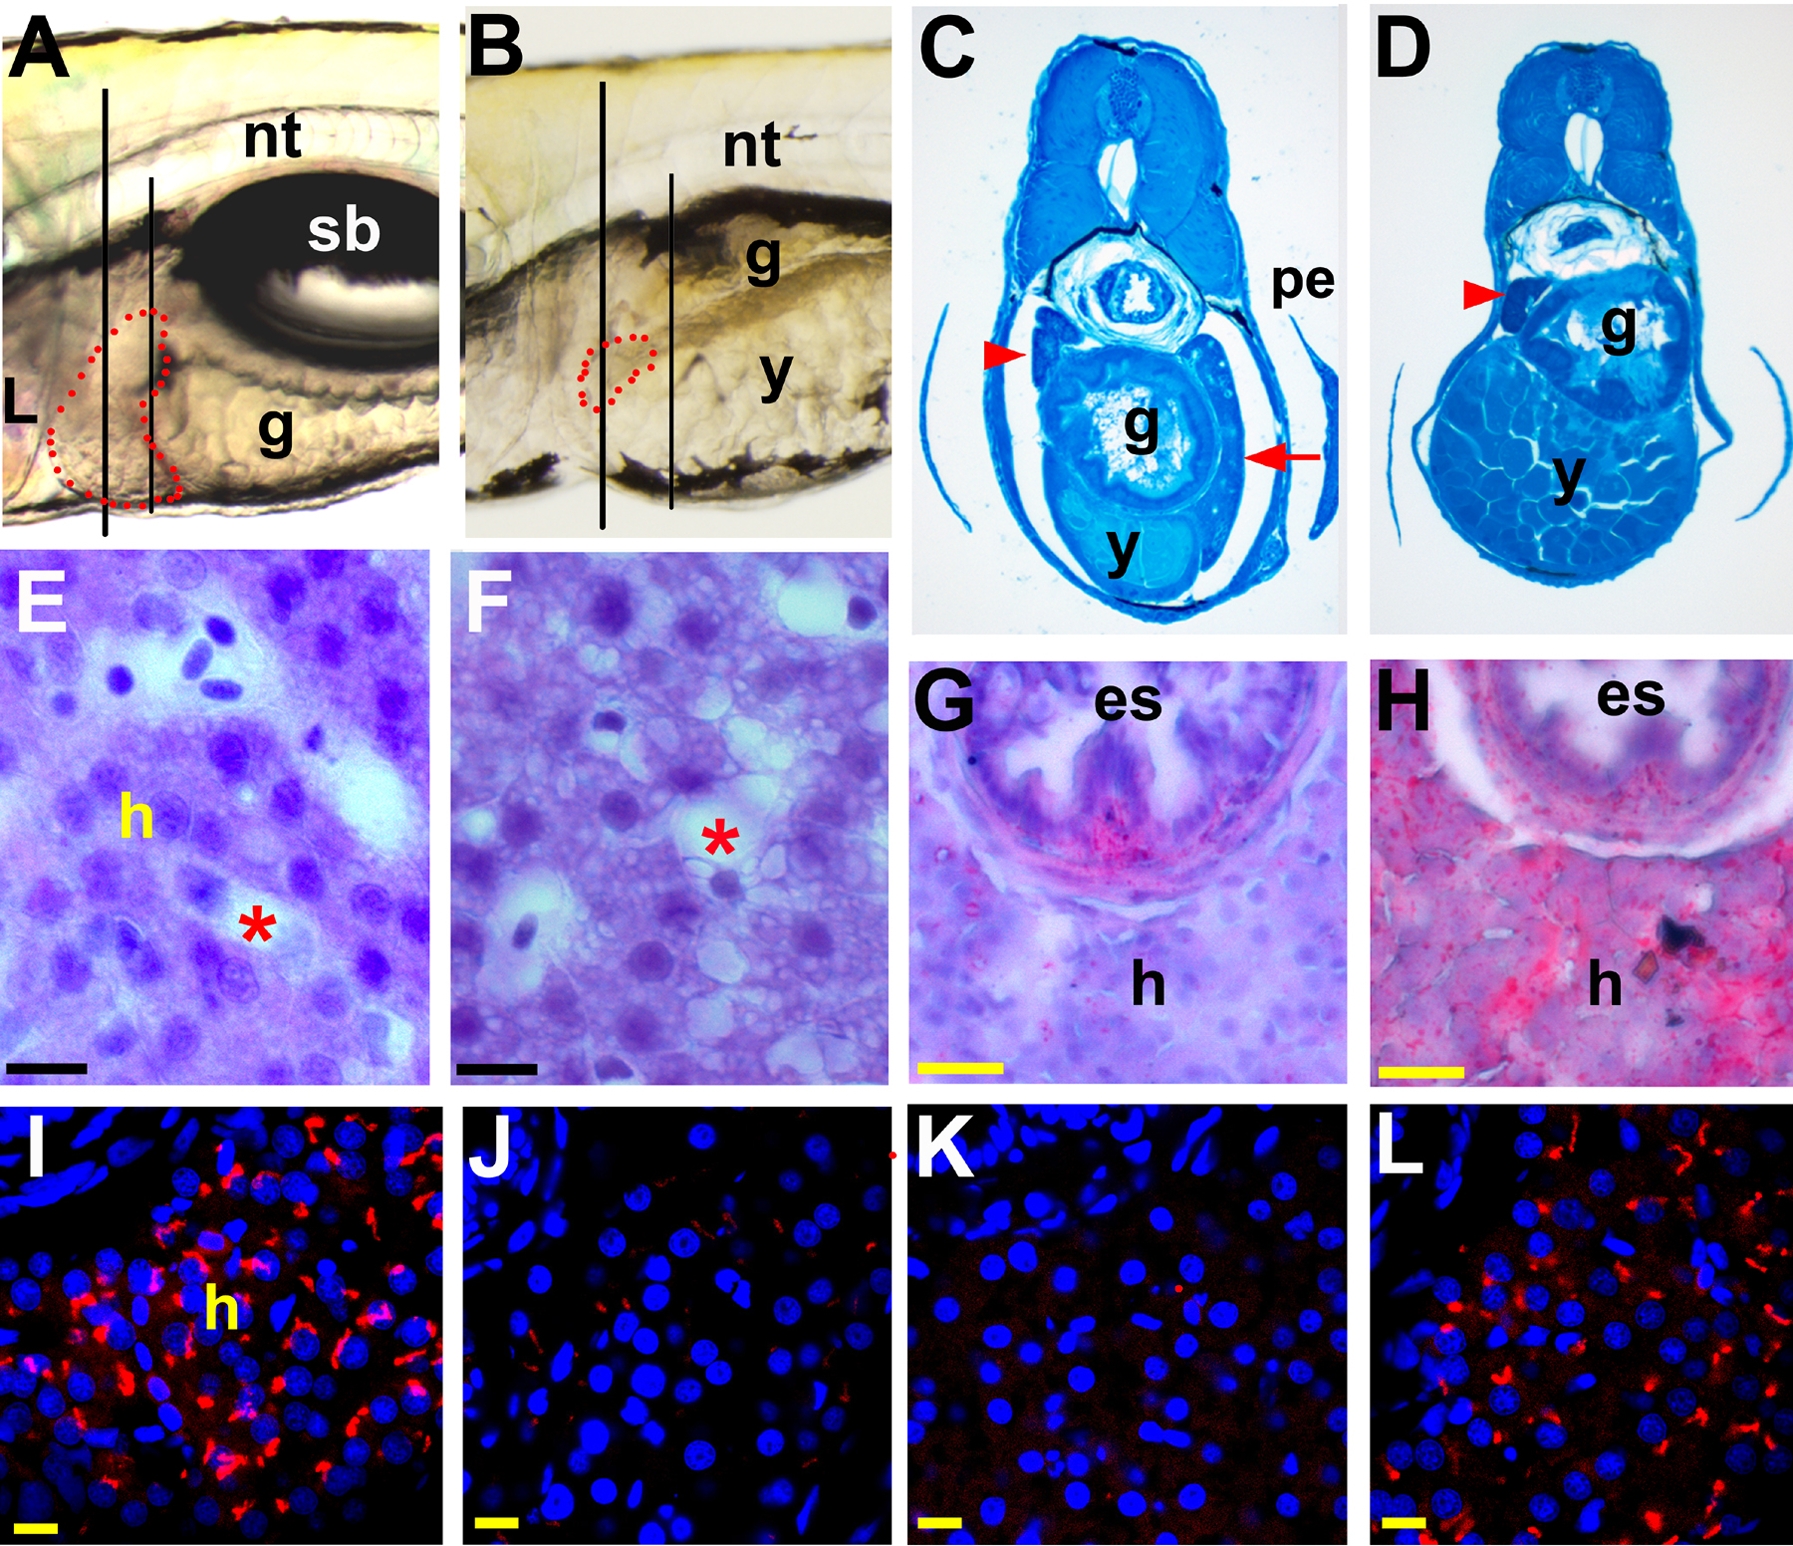
Fig. 5 A2ML knock-down phenotypes in the liver.
Embryos injected with cont MO (A, C, E, G, I), A2ML ATG MO (B, D, F, H, J), A2ML UTR MO (K), and embryo rescued by co-injection of ATG MO and mRNA (L) were analyzed at 5.5 dpf. (C–F) plastic sections, (G–L) cryosections. A–B Lateral live images in the area of the liver (indicated by red dotted line); the short vertical line indicates the plane of section for C and D, the long line for E–L. C–D Methylene blue stain. Red arrowhead points to pancreas, red arrow to liver (in C). E–F Hematoxylin and Eosin (H&E) stained liver section. Asterisks are sinusoids. G–H Lipid staining of liver using Oil-Red O for cont MO (G) and A2ML ATG MO-injected embryos (H). I–L Confocal images for P-glycoprotein IHC; either MO eliminates P-glycoprotein staining (J and K), while mRNA coinjection rescues staining (L). Scale bars represent 10 μm in E–F and 50 μm in G–L. g, gut; h, hepatocytes; L, liver; n, notochord; pe, pectoral fin; y, yolk.