
|
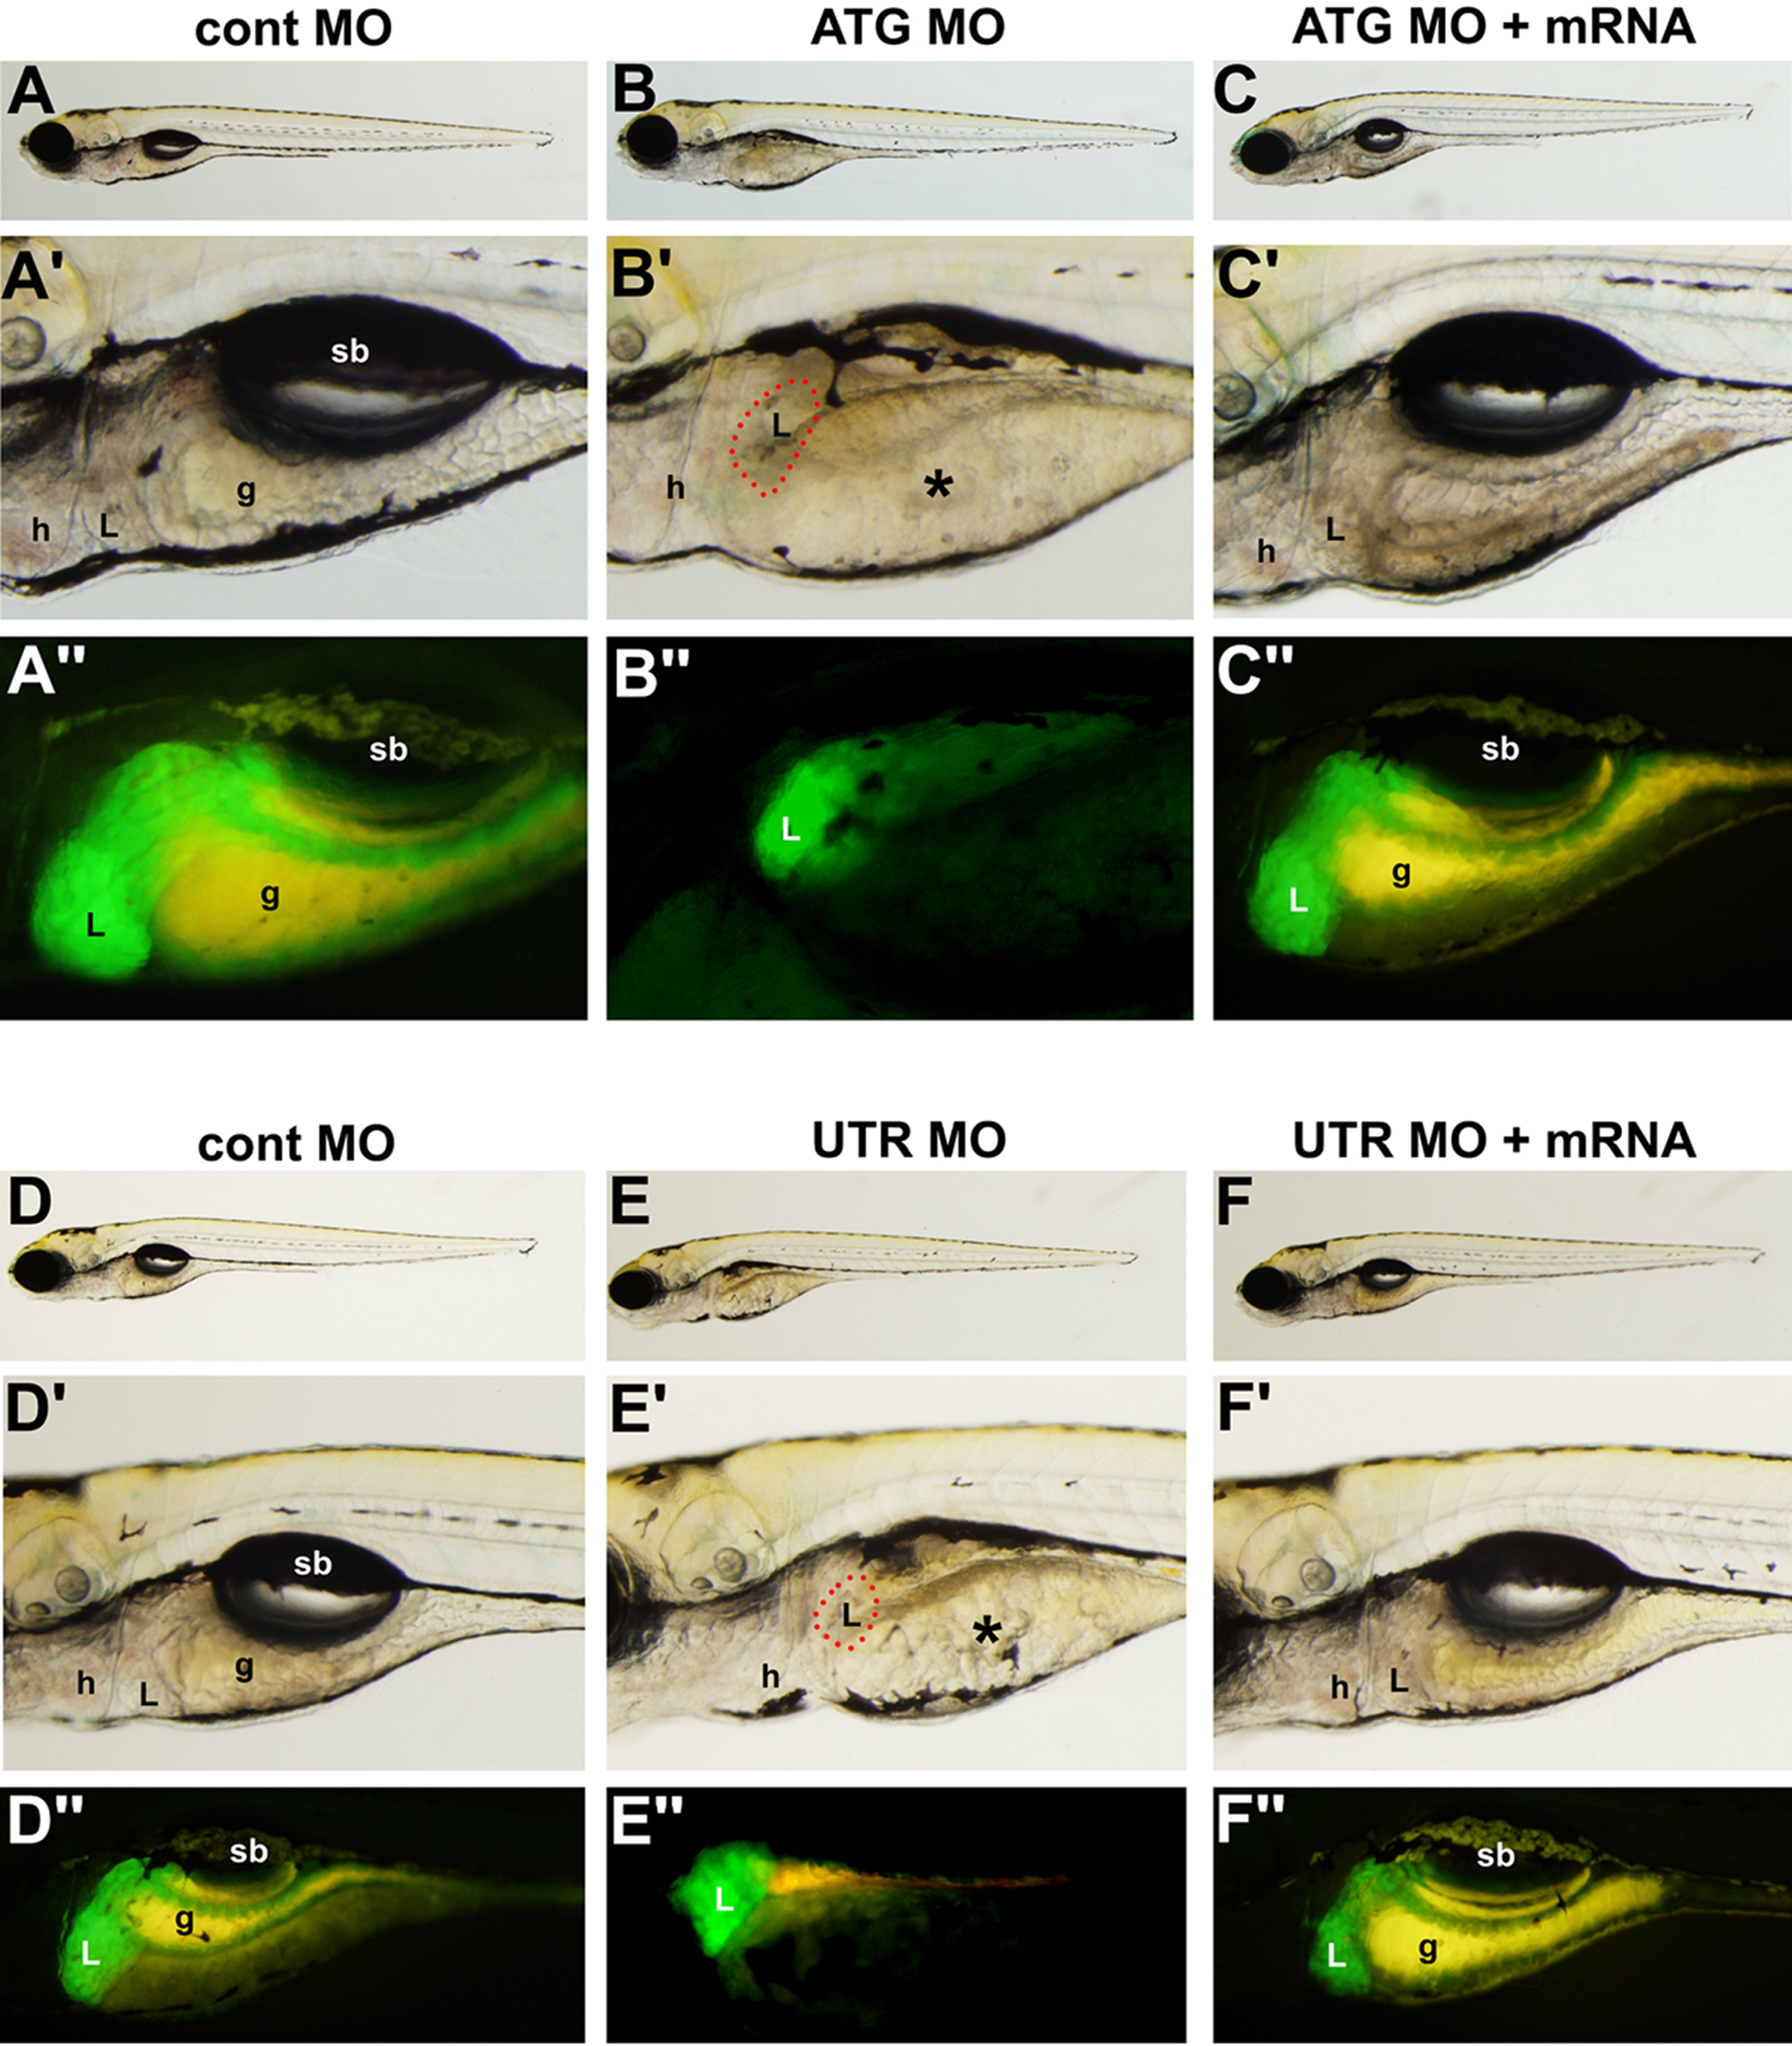
Fig. 3 A2ML MOs affect liver formation.
Embryos from the ef1a-GFP transgenic line are shown at 5dpf. A–A″. cont MO-injected embryos (95% normal, n = 30). B–B″. A2ML ATG MO-injected embryos showed reduced liver in 90% (n = 45) of cases. C–C″ Rescue of A2ML ATG MO phenotype by co-injection with A2ML mRNA (80% rescued, n = 45). D–D″. Cont MO-injected embryos (99% normal, n = 35). E–E″. A2ML UTR MO injected embryos (98% defect, n = 55). F–F″. Rescue of A2ML UTR MO phenotype by co-injection with A2ML mRNA (90% rescued, n = 47). See Experimental Procedures for injection levels. Red outlines in B′ and E′ represent the small livers remaining in these embryos. Asterisks in B′ and E′ identify yolk. g, gut; h, heart; L, liver; sb, swim bladder.