
Image
|
Figure Caption
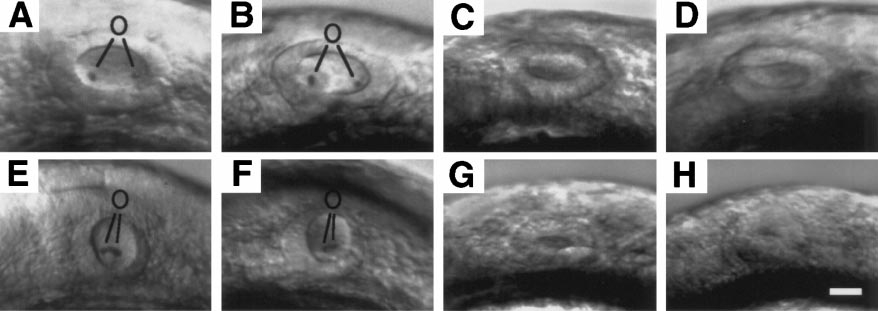
Fig. 2 Effects of various mutations on morphology of the otic vesicle. Shown are otic vesicles at 24 h in (A) wild-type, (B) ntl-, (C) oep-, (D) ntl-;oep-, (E) val-, (F) ntl-;val-, (G) oep-;val-, and (H) ntl-;oep-;val- embryos. Where appropriate, otoliths (o) are indicated. Scale bar, 25 μm.
Acknowledgments
This image is the copyrighted work of the attributed author or publisher, and
ZFIN has permission only to display this image to its users.
Additional permissions should be obtained from the applicable author or publisher of the image.
Reprinted from Developmental Biology, 206, Mendonsa, E.S. and Riley, B.B., Genetic analysis of tissue interactions required for otic placode induction in the zebrafish, 100-112, Copyright (1999) with permission from Elsevier. Full text @ Dev. Biol.