
|
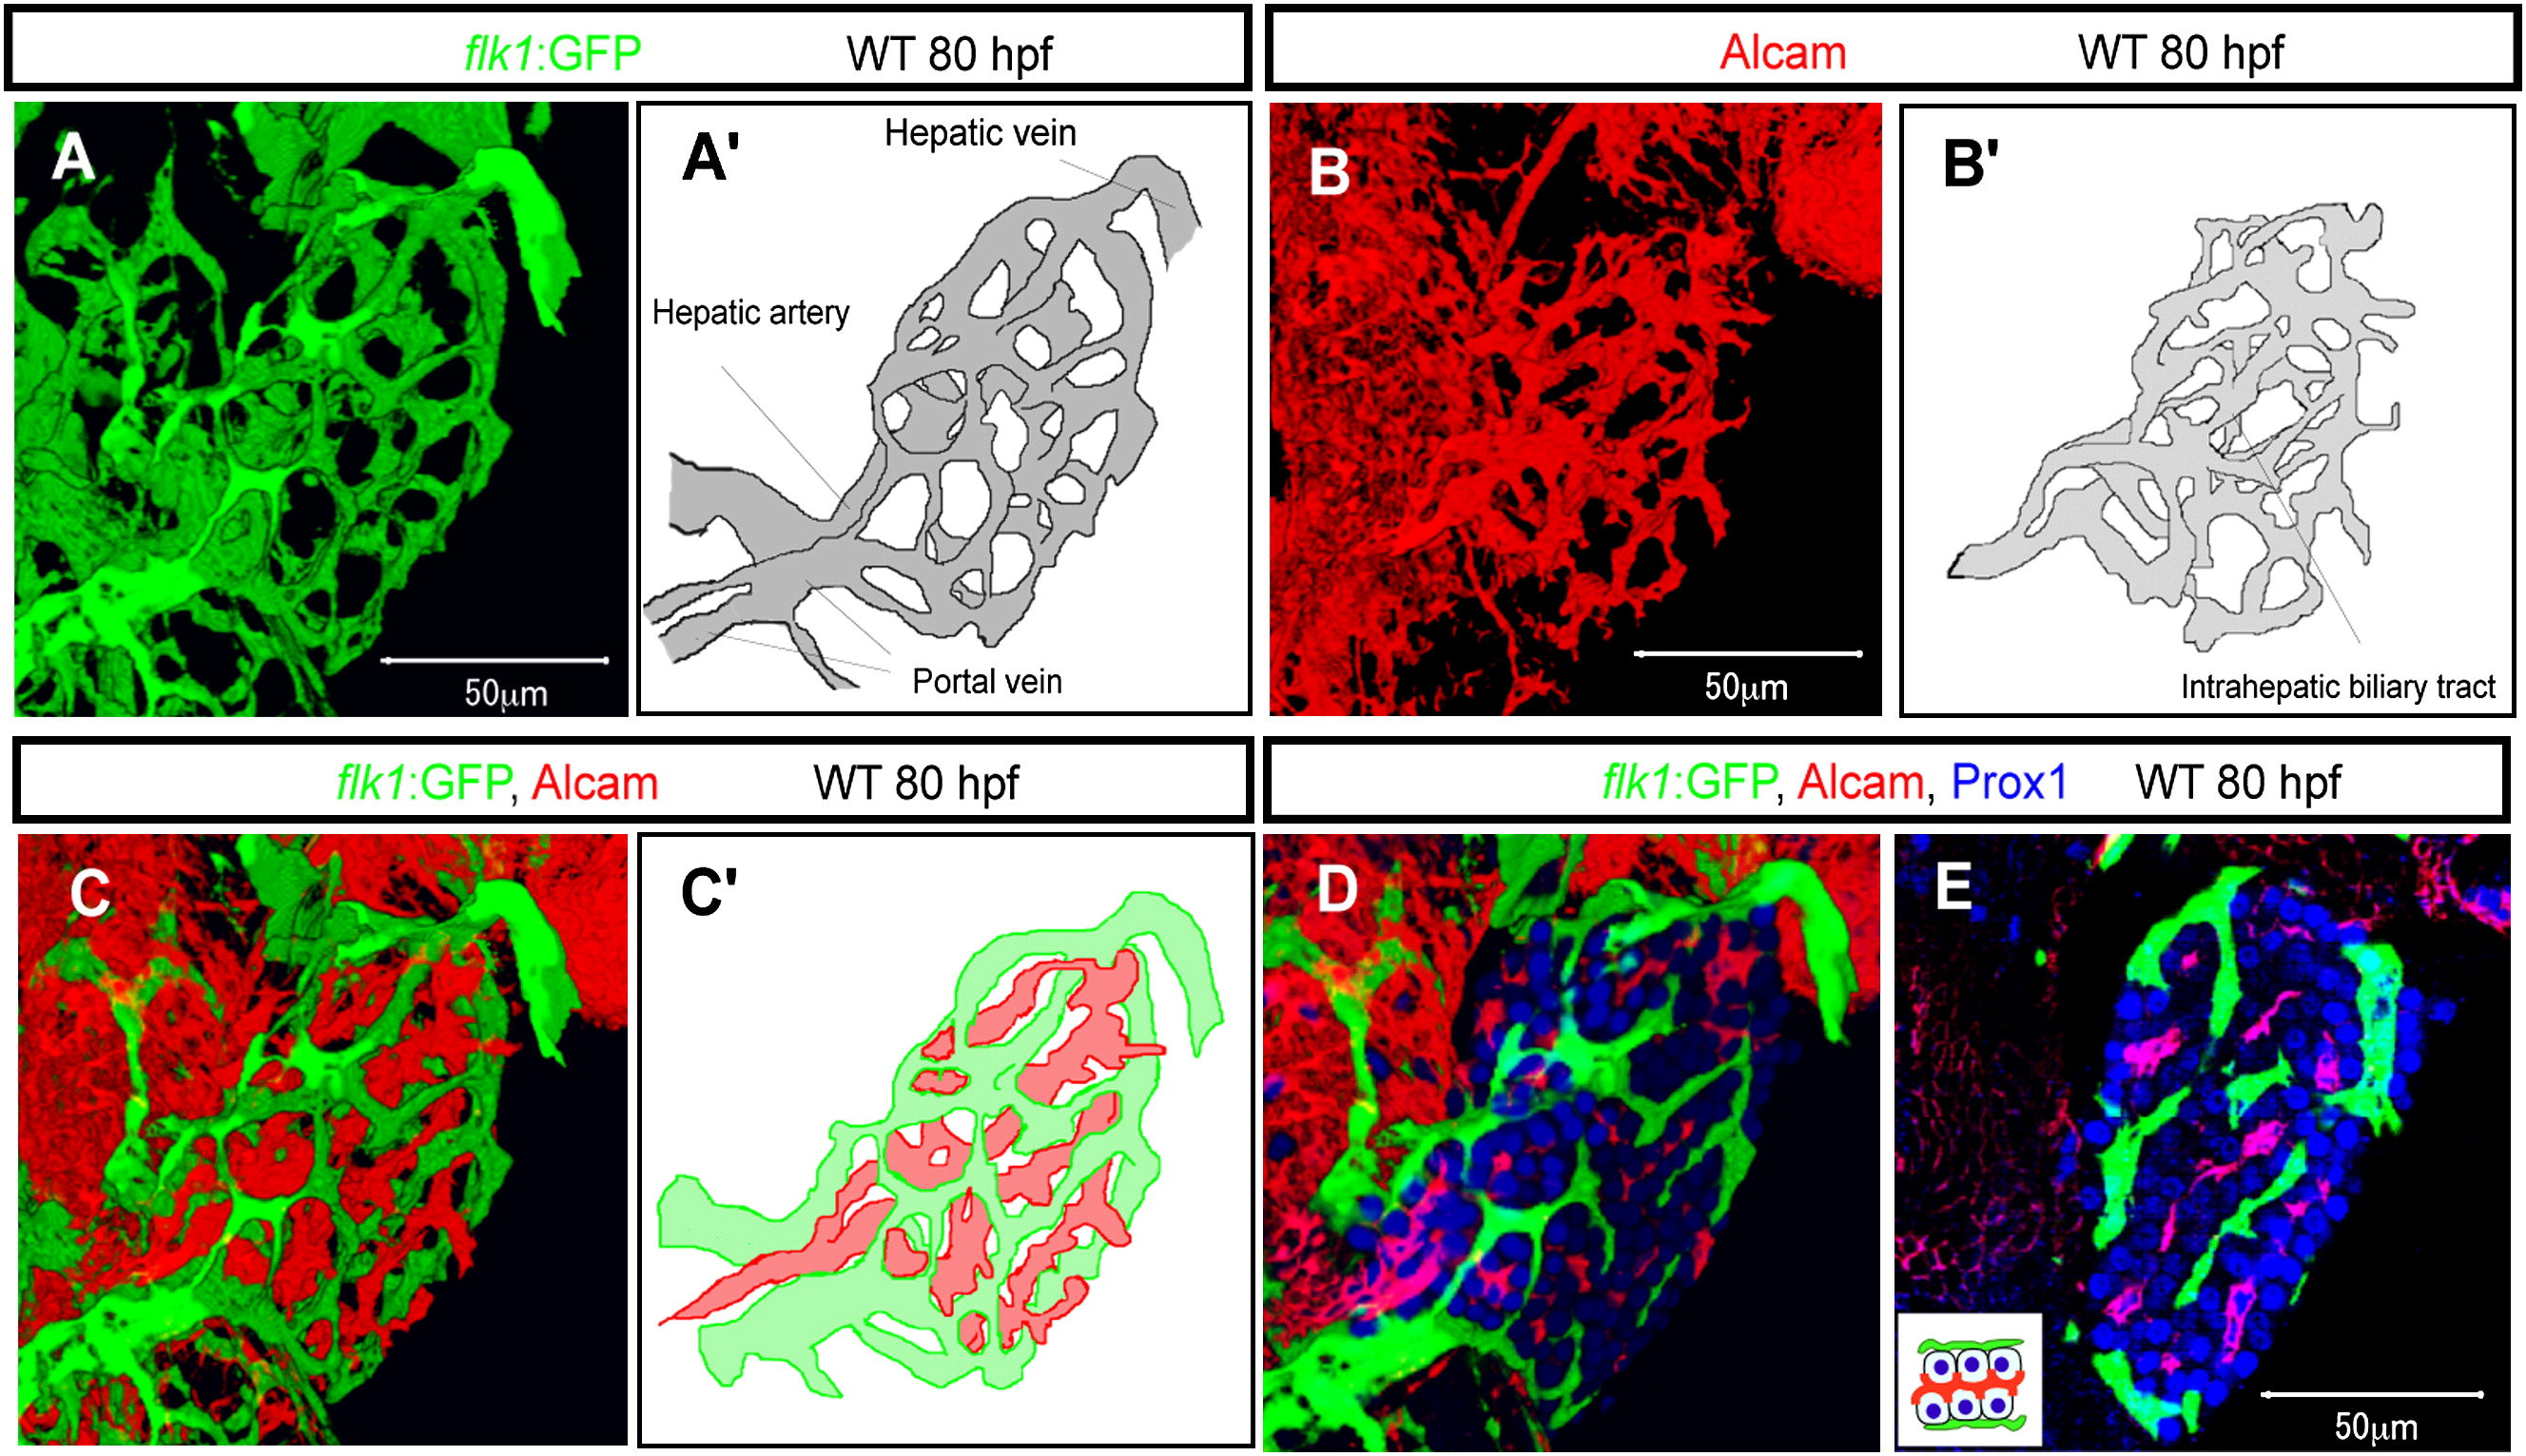
Fig. 1 The Vascular and Biliary Networks in the Developing Zebrafish Liver
(A and A′) Projected confocal image of Tg(flk1:EGFP)s843 expression in the liver at 80 hpf. The intrahepatic vascular network visualized by Tg(flk1:EGFP)s843 expression is schematically presented in (A′).
(B and B′) Projected confocal image of Alcam expression at 80 hpf. The intrahepatic biliary network visualized by Alcam staining is schematically presented in (B′).
(C and C′) Merged image of Tg(flk1:EGFP)s843 (green) and Alcam (red) expression shows that the intrahepatic vascular and biliary networks always maintain a certain distance between each other. The intrahepatic vascular (green) and biliary (red) networks are schematically represented in (C′).
(D and E) Projected confocal image (D) and z-plane confocal image (E) of Tg(flk1:EGFP)s843 larvae visualized for GFP (green), Prox1 (blue), and Alcam (red) expression. Monolayers of hepatocytes separate the vascular and biliary networks, as illustrated in the inset.