
|
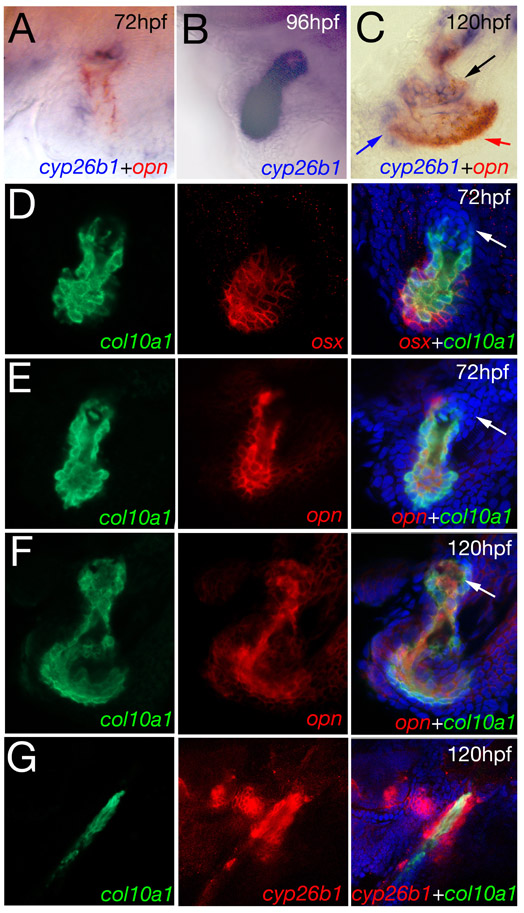
Fig. S4 Expression pattern of cyp26b1 in craniofacial bone elements in comparison to opn and osx. Stainings of wild-type animals at stages indicated in upper right corners, and with in situ RNA probes indicated in lower right corners. (A-C) cyp26b1 and opn are coexpressed in the opercle. The opn-positive cells in A display weak cyp26b1 expression that is not visible in this image (but compare with Fig. 3A); the opercle visible in B is overstained, showing similar signals in strongly and weakly expressing cells. In C, cells with cyp26b1 and opn coexpression are indicated with black arrow, cells positive for cyp261 or opn mRNA only with blue or red arrows, respectively. (D-G) Confocal sections of double fluorescent in situ hybridizations, counterstained with DAPI to visualize nuclei (blue). In left panels, col10a1 expression is in green; in middle panels, osx, opn or cyp26b1 expression is in red; in right-hand panels, merged green and red channels, superimposed by DAPI staining. (D-F) col101a1, osx and opn are coexpressed in the opercle. At 72 hpf, osteoblasts in central versus peripheral regions of the elements display slightly different signatures. opn expression is highest in regions close to the bony core of the element (E; compare with Fig. 3C), col10a1 expression is strongest in intermediate positions (E), whereas osx is strongest in peripheral regions (D). This suggests that opn is preferentially made by the most mature/most active osteoblasts, whereas osx marks more immature osteoblasts. cyp26b1 seems to be most strongly expressed in even less advanced osteoblasts. At 72 hpf, it displays strong expression at the dorsal base of the element (see Fig. 3A), which at that time is negative for osx, col10a1 and opn (indicated by white arrows in D,E). By contrast, col10a1 and opn are expressed in these dorsal cells at 120 hpf (indicated by white arrow in F). Also note that the location of osteoblasts generally shifts to more peripheral positions as the central bony core of the element grows (compare E and F with Fig. 3C,F). (G) cyp26b1 and col10a1 are coexpressed in cells adjacent to the bony core of the cleithrum. However, cyp26b1 levels in these central cells is lower than in more peripheral, col10a1-negative cells, which most likely represent immature and/or inactive osteoblasts.