
|
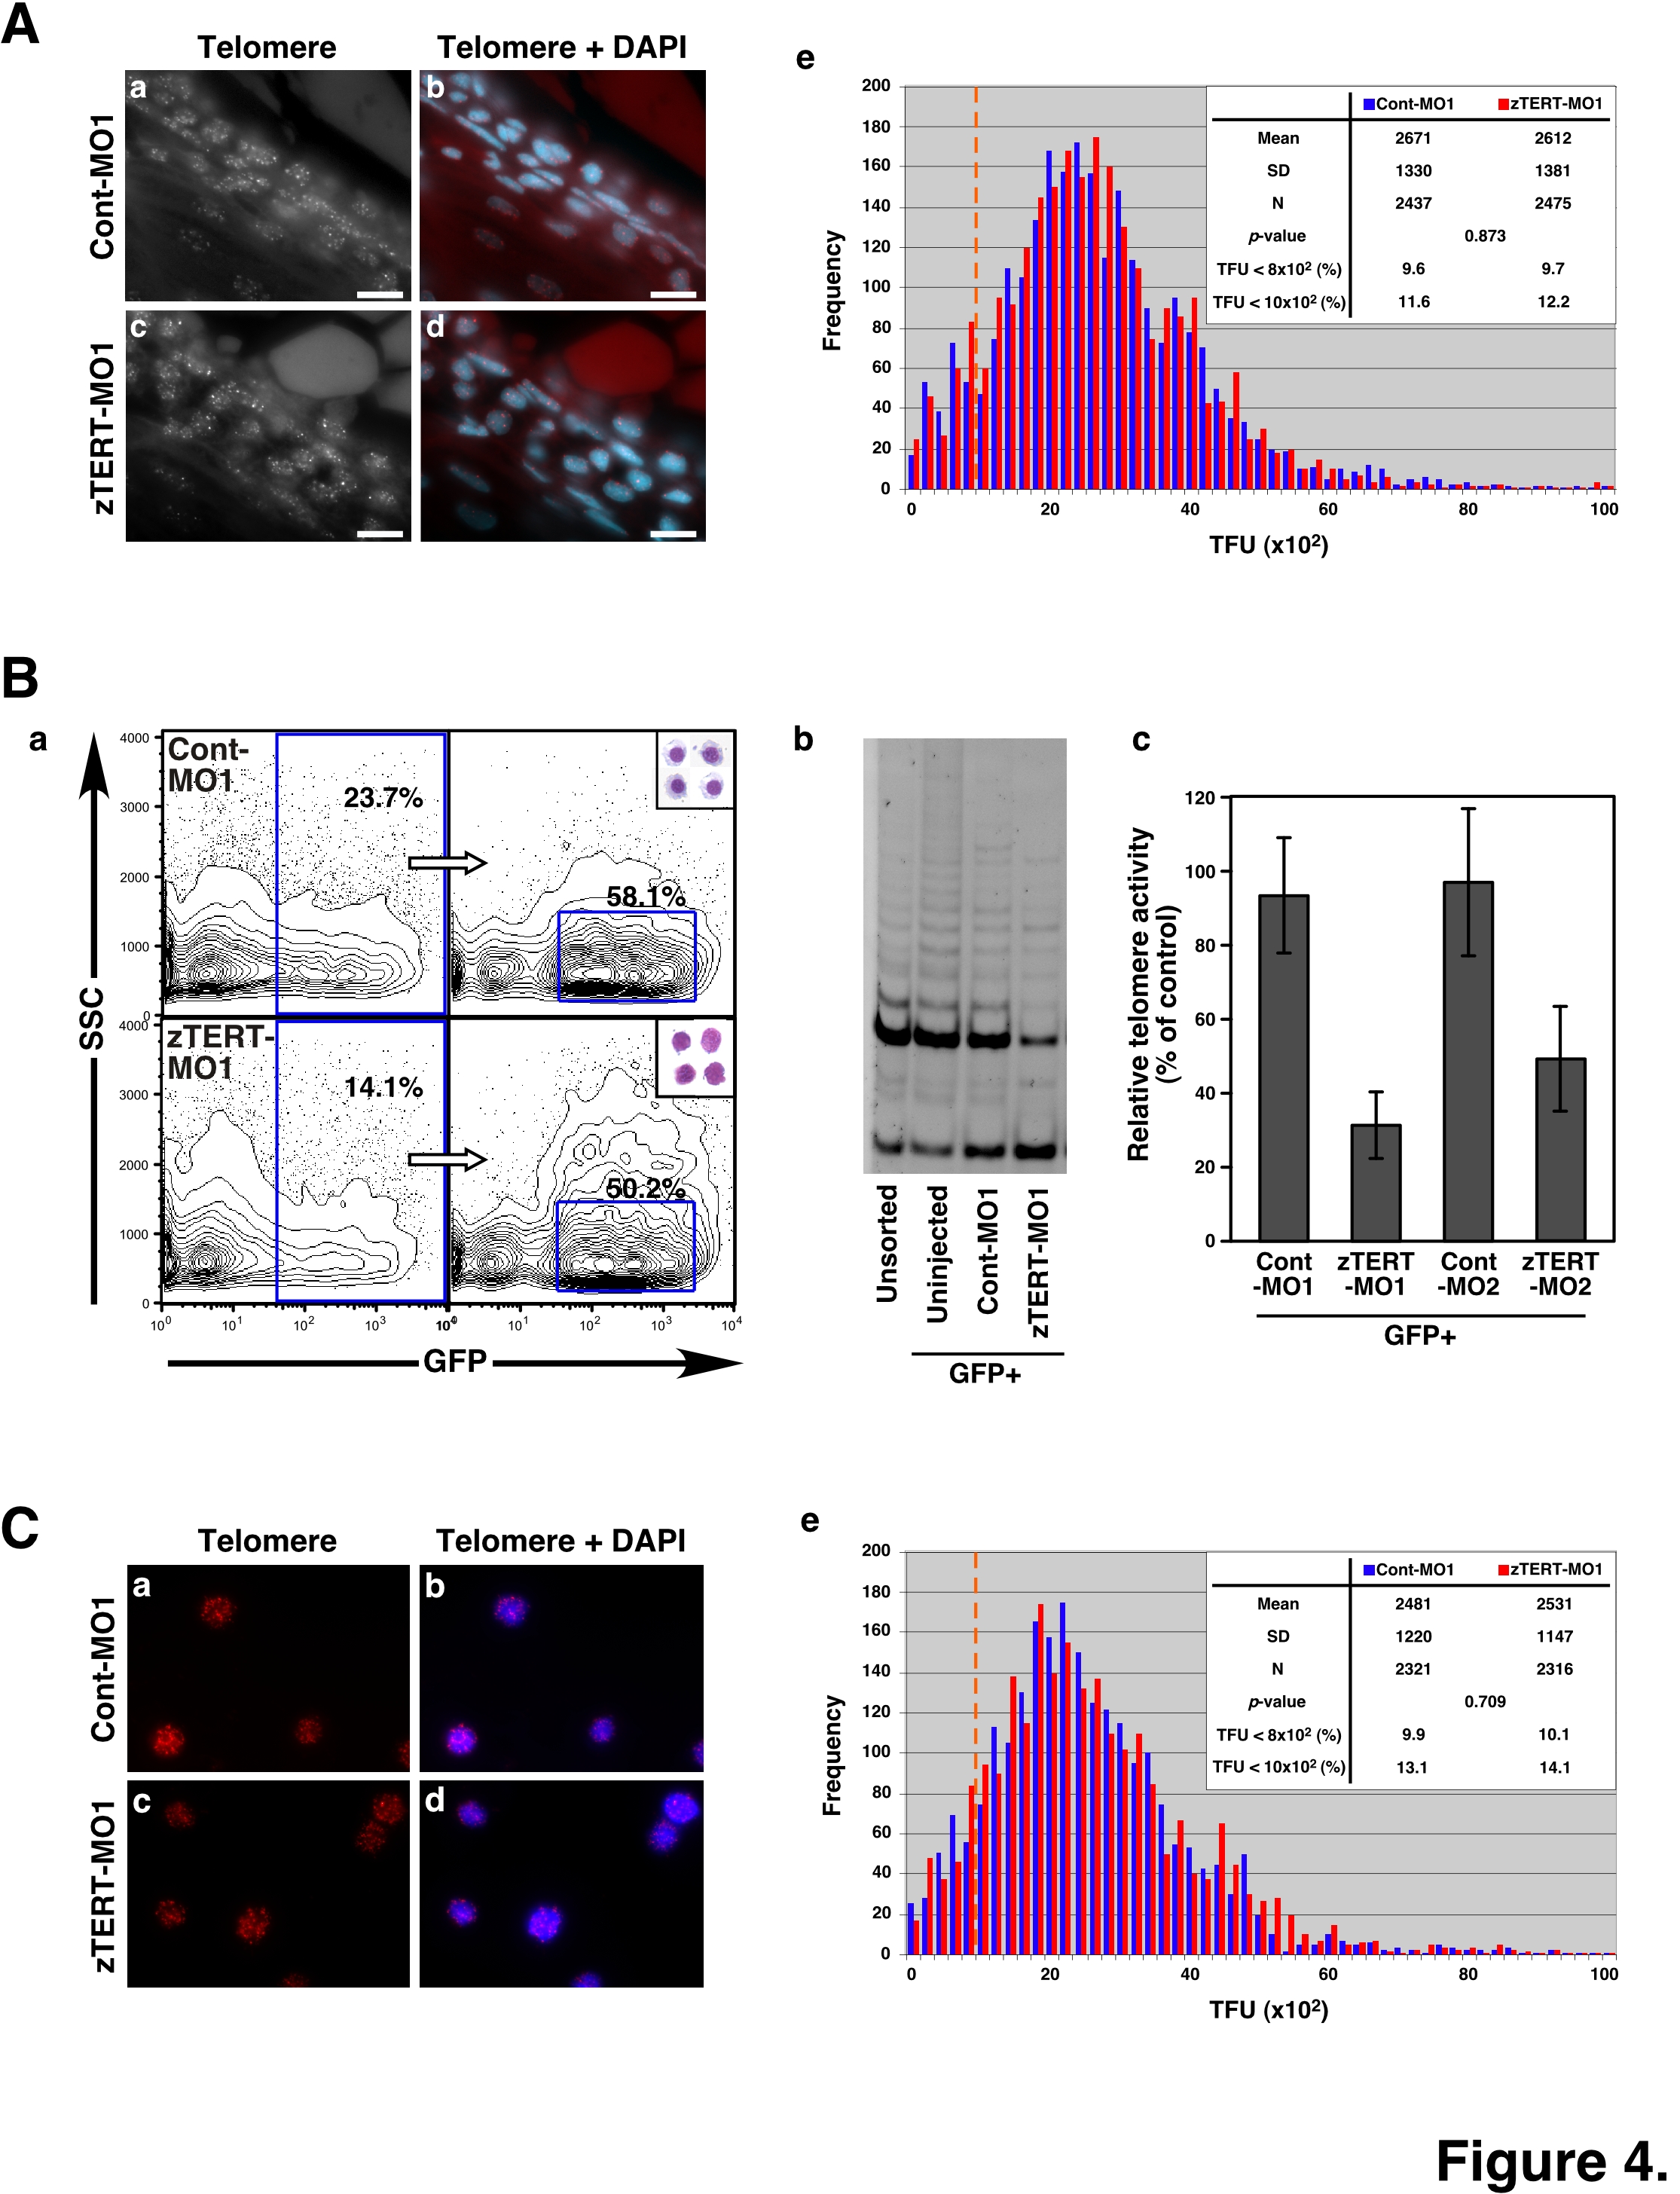
Fig. 4 Telomere length and telomerase activity in the blood cells of zebrafish embryos.
(A) Telomere length analysis of blood cells in tissue sections from control and TERT morphant embryos by telomere FISH (a, c). The sections were also counterstained with DAPI (b, d). The intensities of the fluorescent speckles detected with a telomere PNA probe reflect the corresponding telomere lengths (a, c; grayscale; bar, 10 μm). Nuclei were counterstained with DAPI and merged with telomere spots on the captured images (b, d; bar, 10 μm). (e) Q-FISH histograms showing telomere fluorescence in blood cell nuclei from control (the blue color bars) and TERT morphants (the red color bars), as measured using the TFL-TELO software. The x-axis depicts the intensity of each signal as expressed in telomere fluorescence intensity units (TFU), and the y-axis shows the frequency of telomeres of a given intensity. The dashed orange line indicates 10x102 TFU. (B) Zebrafish erythroid cells were isolated from gata-1-promoter-driven GFP (gata-1GFP) transgenic fish by FACS (a). TRAP assay of telomerase activity in gata-1GFP-positive blood cells (b). Quantification of telomerase activity by captured image analyses in GFP-positive cells from the MO1- and MO2-injected samples (c). The activity in GFP-positive cells from uninjected samples was used as a control. (C) Telomere length analysis of gata-1GFP-positive blood cells from control and TERT morphant embryos by telomere FISH (a, c). The intensities of the fluorescent speckles detected with a telomere PNA probe reflect the corresponding telomere lengths. Nuclei were counterstained with DAPI and merged with telomere spots on the captured images (b, d; bar). (e) Q-FISH histograms showing telomere fluorescence in blood cell nuclei from control (the blue color bars) and TERT morphants (the red color bars), as measured using the TFL-TELO software. The x-axis depicts the intensity of each signal as expressed in telomere fluorescence intensity units (TFU), and the y-axis shows the frequency of telomeres of a given intensity. The dashed orange line indicates 10x102 TFU.