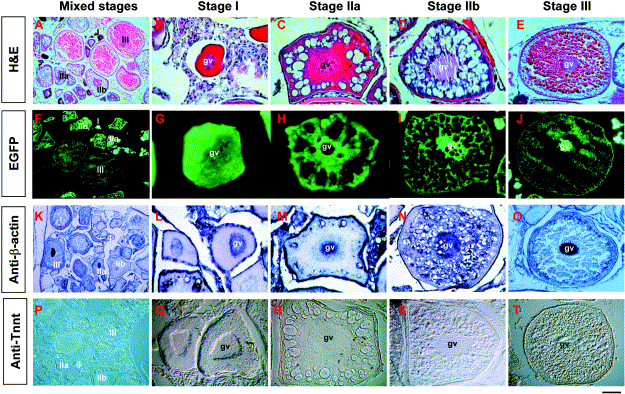
Fig. 2 Subcellular distribution of EGFP and β-actin in female gonads of β9 TG(β-actin:EGFP) detected by cryosection or immunohistochemistry. (A–E) Paraffin sections of female gonads. Sections are stained with H&E. (F–J) Cryosections of female gonads. (K–O) Immunohistochemistry of female gonads with β-actin monoclonal antibody. (P–T) Immunohistochemistry of female gonads with troponin T monoclonal antibody. Overviews of gonadal sections at low magnification (A, F, K, P). High magnification of oocytes at the primary growth stage (B, G, L, Q), early (C, H, M, R), middle (D, I, N, S), and late (E, J, O, T) vitellogenic stages. gv, germinal vesicle; I, stage I (primary growth stage) oocyte; IIa, stage IIa (early vitellogenic stage) oocyte; IIb, stage IIB (middle vitellogenic stage) oocyte; III, stage III (late vitellogenic stage) oocyte. Scale BAR = 250 μm in (A, F, K, P), 100 μm in (E, J, O, T), 60 μm in (D, I, N, S), and 30 μm in (B, C, G, H, L, M, Q, R).
Reprinted from Developmental Biology, 262, Hsiao, C.-D. and Tsai, H.-J., Transgenic zebrafish with fluorescent germ cell: a useful tool to visualize germ cell proliferation and juvenile hermaphroditism in vivo, 313-323, Copyright (2003) with permission from Elsevier. Full text @ Dev. Biol.

