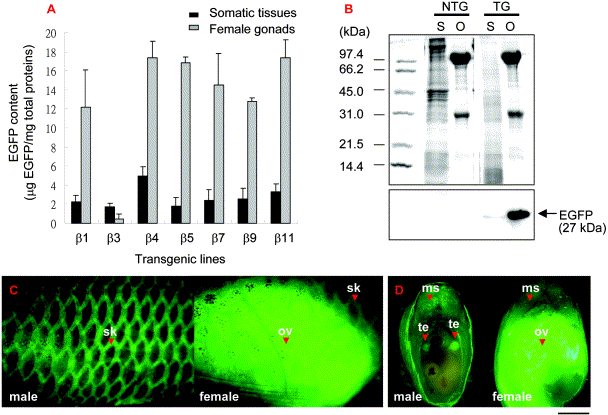
Fig. 1 High accumulation of EGFP in female gonads of TG(β-actin:EGFP). (A) Comparison of EGFP accumulated in somatic tissues (black filled boxes) and female gonads (gray filled boxes) among seven distinct transgenic lines (β1, β3, β4, β5, β7, β9, and β11). EGFP content was evaluated with a fluorescence spectrophotometer and normalized against the same amount of a total soluble protein. Values are the means ± SE of five replicates. (B) SDS-PAGE (upper panel) and Western blot (lower panel) analyses of EGFP accumulated in gonads of β9 TG(β-actin:EGFP). S, soluble proteins extracted from somatic tissues; O, soluble proteins extracted from female gonads; NT, non-transgenics; TG, transgenics. Arrow indicates the positive signal of the 27-kDa EGFP protein. Protein markers are shown on the left; sizes are in kDa. (C) Sexually dimorphic expression of EGFP in the male (left) and female (right) gonads of β9 TG(β-actin:EGFP) at 60 dpf. TG(β-actin:EGFP) are viewed laterally; anterior to the left of the figure. (D) Transverse sections showing the relative intensity of fluorescent gonads in male (left) and female (right) TG(β-actin:EGFP). ms, muscle; ov, ovary; sk, skin; te, testis. Scale BAR = 250 μm in (C) and 200 μm in (D).
Reprinted from Developmental Biology, 262, Hsiao, C.-D. and Tsai, H.-J., Transgenic zebrafish with fluorescent germ cell: a useful tool to visualize germ cell proliferation and juvenile hermaphroditism in vivo, 313-323, Copyright (2003) with permission from Elsevier. Full text @ Dev. Biol.

