Image
Figure Caption
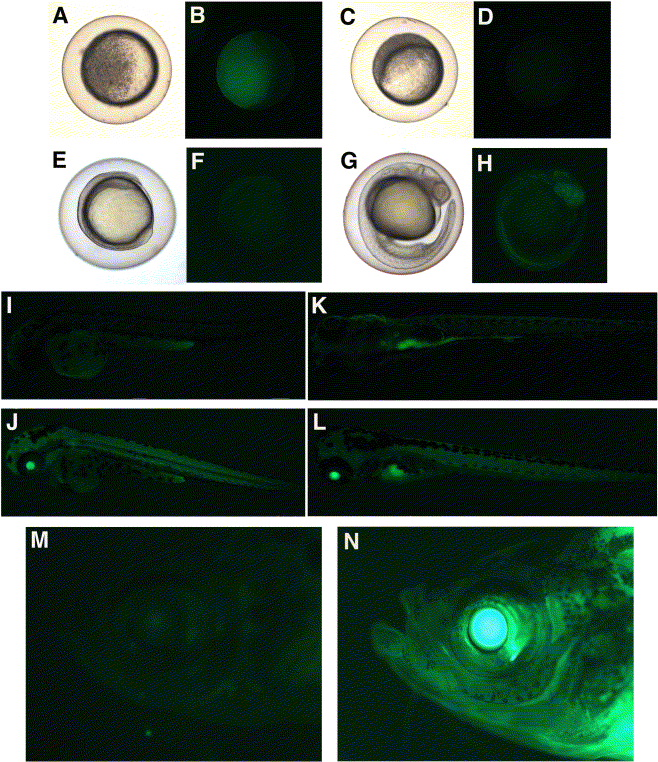
Fig. 5 Expression analysis of T/XEX-GM2′2. Progeny from a homozygous transgenic female outcross (A, B) and a homozygous transgenic male outcross (C, D, E–H, J, L) are compared with wt embryos (I, K). Embryos were analyzed at the late sphere stage (A–D); 3- to 4-somite (E, F); 24 hpf (G, H); 48 hpf (I, J); 5 dpf (K, L), and homozygous adults (N) were compared with wt adults (M) for GFP expression. Images were captured under brightfield (A, C, E, G) and a bandpass GFP filter set (B, D, F, H, I, J, K, L, M, N).
Acknowledgments
This image is the copyrighted work of the attributed author or publisher, and
ZFIN has permission only to display this image to its users.
Additional permissions should be obtained from the applicable author or publisher of the image.
Reprinted from Developmental Biology, 263(2), Davidson, A.E., Balciunas, D., Mohn, D., Shaffer, J., Hermanson, S., Sivasubbu, S., Cliff, M.P., Hackett, P.B., and Ekker, S.C., Efficient gene delivery and gene expression in zebrafish using the Sleeping Beauty transposon, 191-202, Copyright (2003) with permission from Elsevier. Full text @ Dev. Biol.

