
|
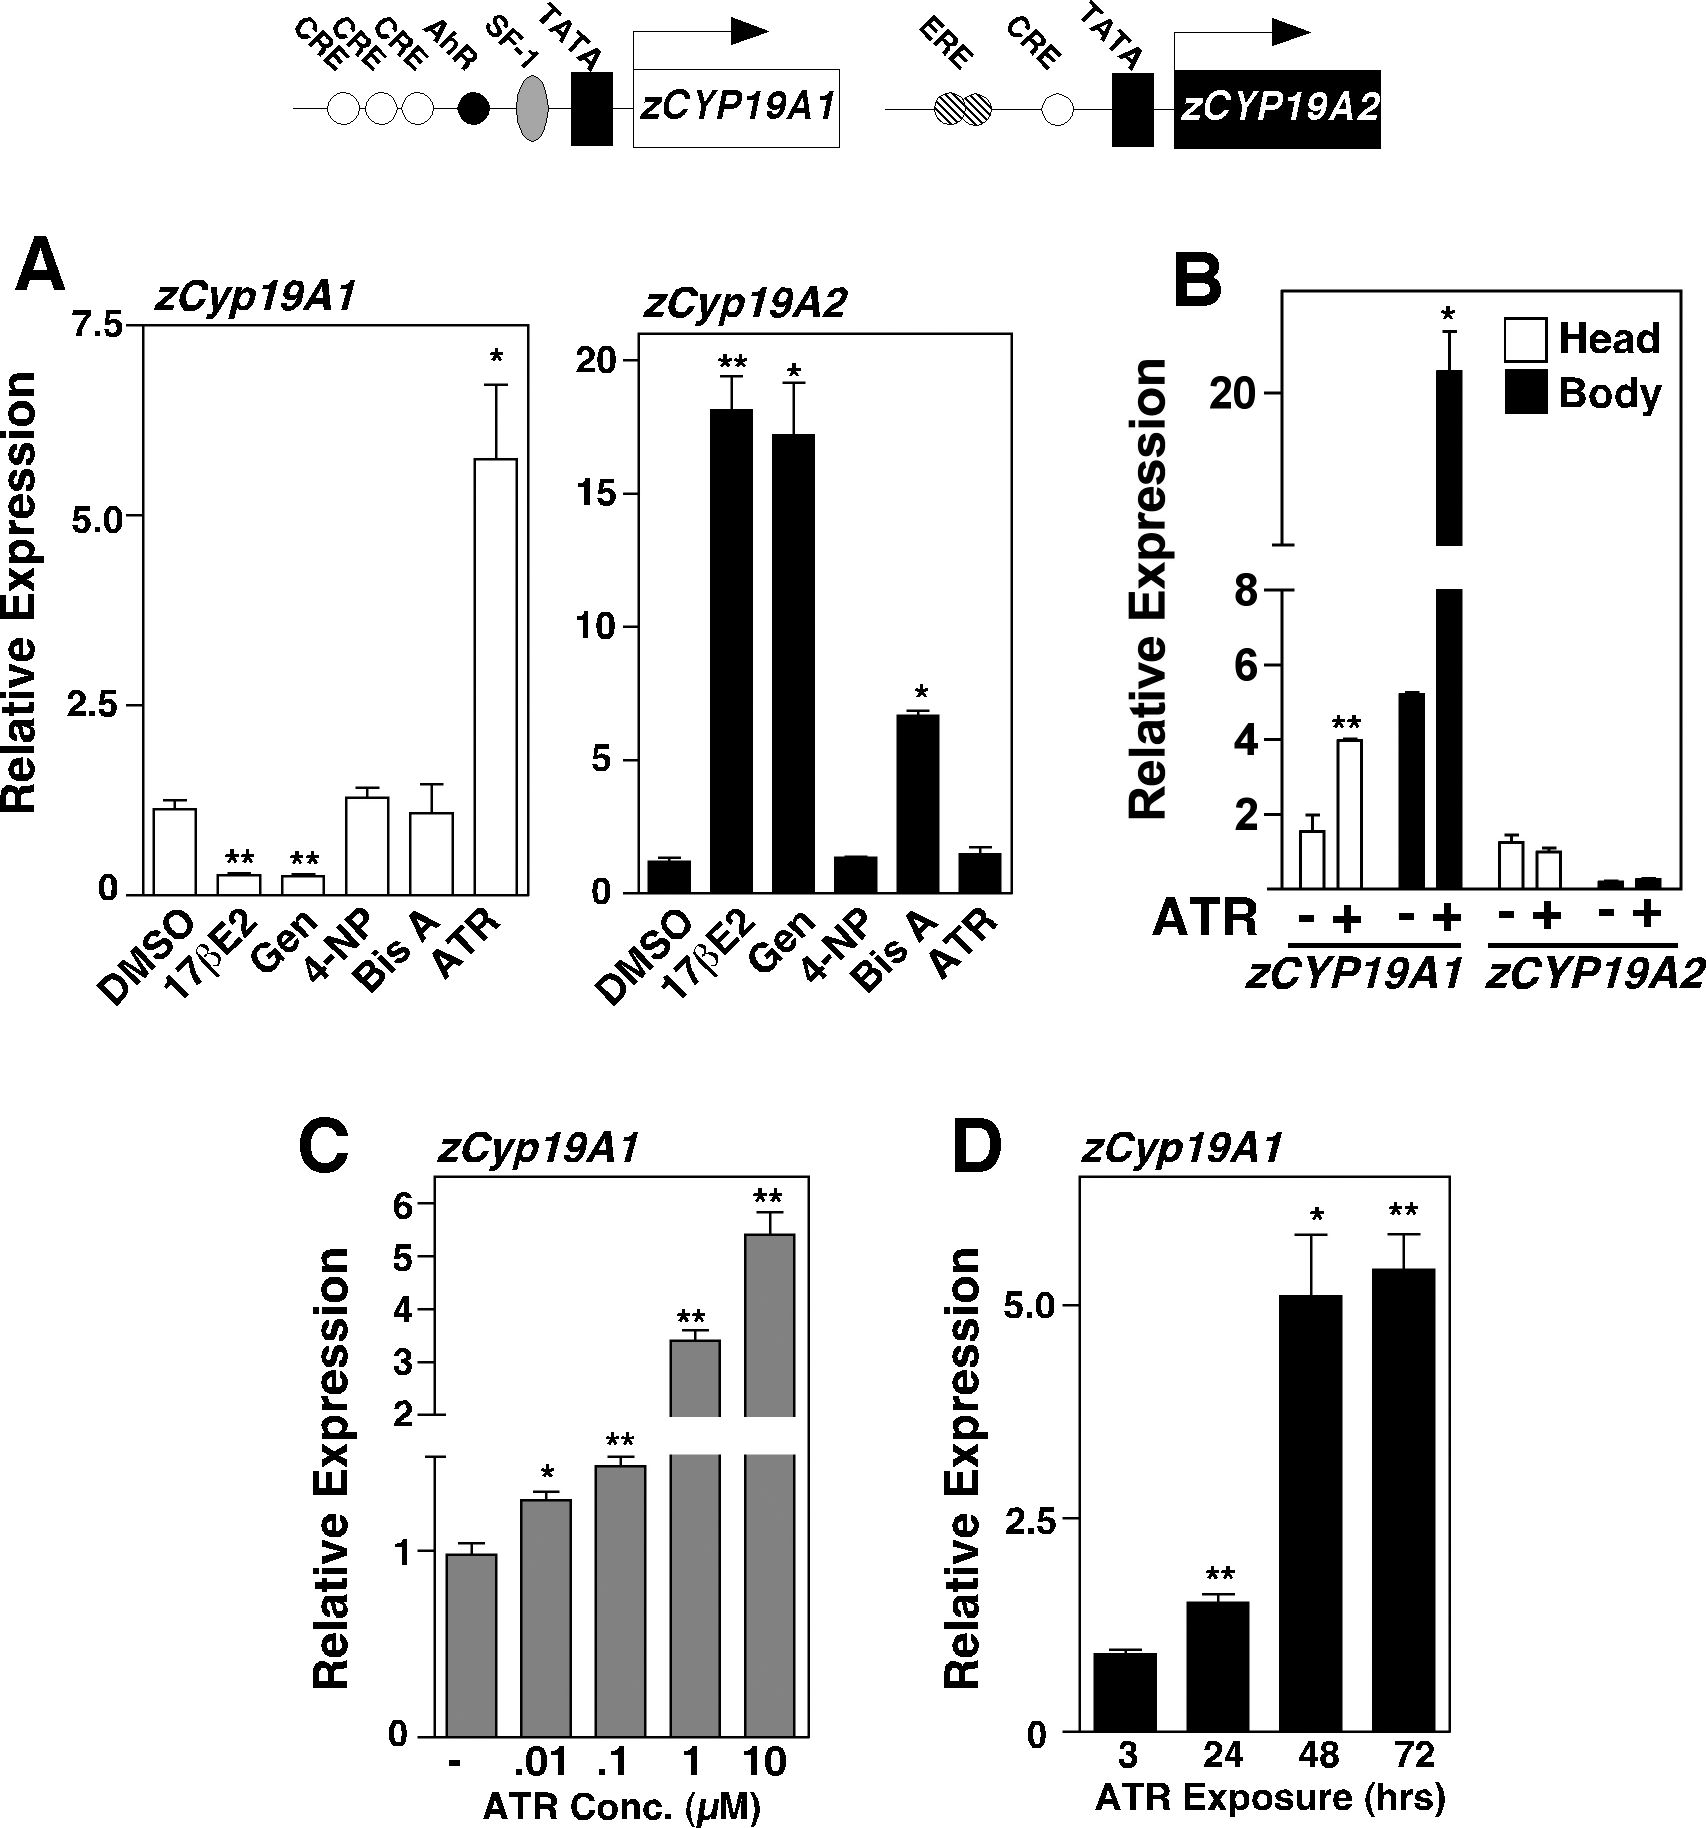
Fig. 1
ATR stimulates expression of gonadal zcyp19A1 encoding aromatase, but not zcypA2 in zebrafish.
Schematic of zCyp19a1 and zCyp19a2 zebrafish promoters with binding sites and start site indicated (arrow) as previously shown by [29]. A. Relative expression of zCyp19a1 and zCyp19a2 transcripts determined by RT-qPCR in juvenile zebrafish (20 dpf) following exposure (72 hrs) to endocrine disruptors including 0.1 μM of 17βE2, 1 μM of genistein (Gen), 10 μM of 4-nonylphenol (4-NP), 10 μM of bisphenol A (Bis A) and 10 μM of atrazine (ATR) beginning at 17dpf. B. Relative expression of zCyp19a1 and zCypA2 transcripts in dissected 20 dpf zebrafish bodies and heads after 72 hrs ATR treatment (10 μM). C. Relative zCyp19a1 and zCyp19a2 transcript levels are shown with ATR stimulation at doses ranging from 0.01 to 10 μM for 72 hrs (left panel), or at different time points (hrs) with 10 μM ATR (right panel). For all panels error bars represent the S.E.M. obtained from analysis of three independent groups of fish (n = 5) using validated primers, with reactions carried out three times each. T-test analysis reveal statistical significance with **p<0.01, *p<0.05.