
|
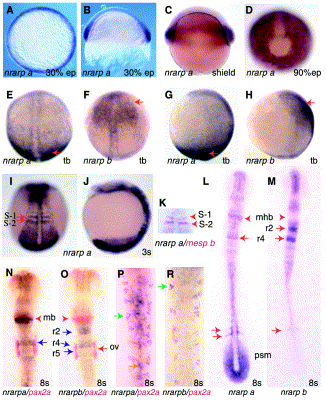
Fig. 2 Expression domains of nrarp a and nrarp b in wild-type embryos as shown by whole mount in situ hybridization. (A–D) Expression pattern of nrarp a: at 30% epiboly: (A) animal pole view; (B) optical section, lateral view; (C) at shield stage, lateral view; and (D) 90% epiboly, vegetal view, dorsal to the top. (E–H) Comparison of nrarp a and b expression pattern at tail bud stage: (E, F) dorsal (G, H) lateral view. Notice complementary patterns in the highest domains both genes (red arrows). (I, J) nrarp a expression at 3 somite stage, (I) dorsal (J) lateral view. (K) Double in situ staining with probes for nrarp a (blue) and mesp b (red). Notice overlapping domains in anterior part of somite primodia S-1 and S-2. (L, M) Expression of nrarp a and b presented in flat mounted embryos at 8 somite stage. (N–R) Double in situ hybridization with probes for pax2a and nrarp a (N, P) and (P, R) nrarp b in flat mounted embryos. Notice more superficial layer with presumptive precursors of sensory neurons (green arrow) and deeper located presumptive motoneurons (orange arrow). Abbreviations: ep, epiboly; ov, otic vesicle; psm, presomitic mesoderm; r, rhombomers; and s, somite.
Reprinted from Gene expression patterns : GEP, 3(2), Topczewska, J.M., Topczewski, J., Szostak, A., Solnica-Krezel, L., and Hogan, B.L.M., Developmentally regulated expression of two members of the Nrarp family in zebrafish, 169-171, Copyright (2003) with permission from Elsevier. Full text @ Gene Expr. Patterns