
|
Fig. 3
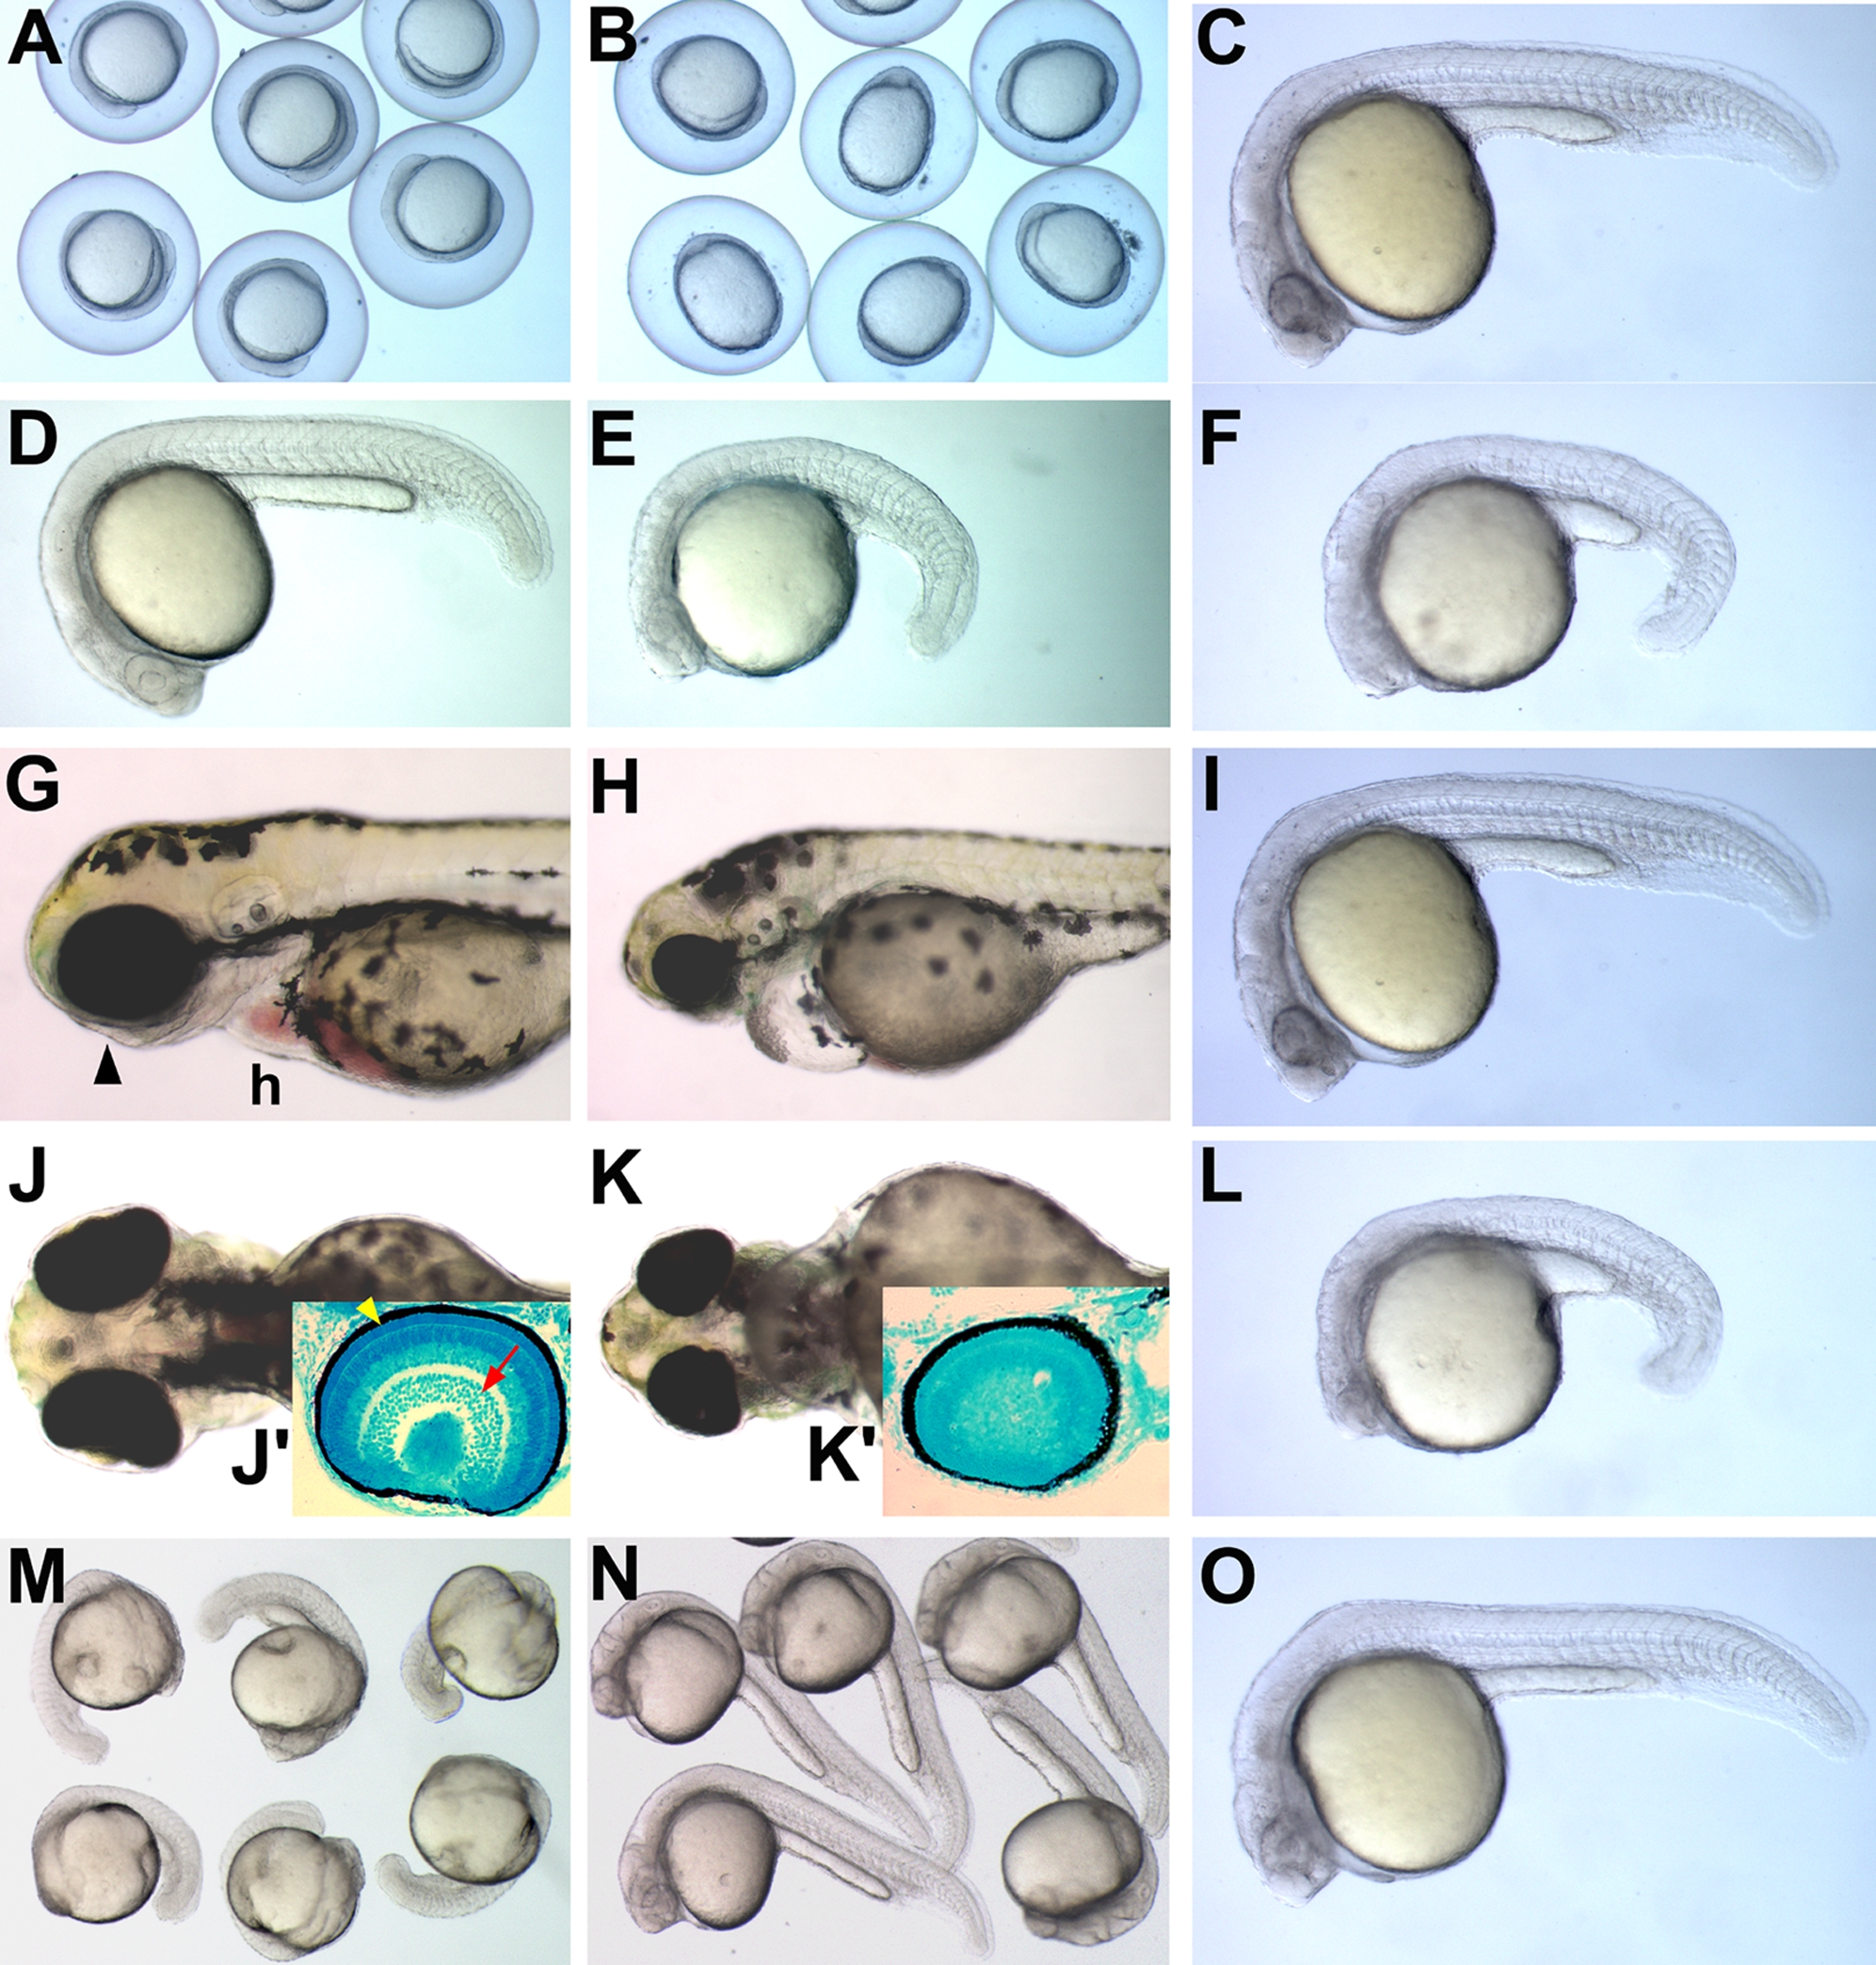
Mych morphant phenotypes.
A–B. Group image of 3-somite stages. Mych MO-injected embryos (B) have reduced anterior and caudal regions compared to control MO-injected embryos (A). C–F. Lateral view of 24hpf MO-injected embryos; (C,D) Control, (E) mych UTR MO, (F) mych SP MO. G–H, J–K. Lateral (G–H) and ventral (J–K) views of control (G,J) and mych UTR MO injected embryos (H,K) at 72hpf. Arrowhead in G points to the eye. Methyl green stained sections of the eye are shown as insets (J′,K′).Yellow arrowhead in J′ indicates ganglion cell layer, and red arrow indicates photoreceptor cell layer of control embryos; mych UTR MO-injected embryos show no retinal layering. F,I. Lateral view of 24hpf mych SP MO injected embryo (F), and embryo rescued by coinjection of mych mRNA (I). L,O. Embryo injected with mych UTR MO (2ng) plus mych SP MO (2.5ng) at 24hpf (L), and rescued embryo after coinjection of mych mRNA (O). M–N. The phenotype of mych UTR MO-injected embryos (M) was rescued by mych mRNA (N), as seen at 24hpf. h, heart.