
|
Fig. 4
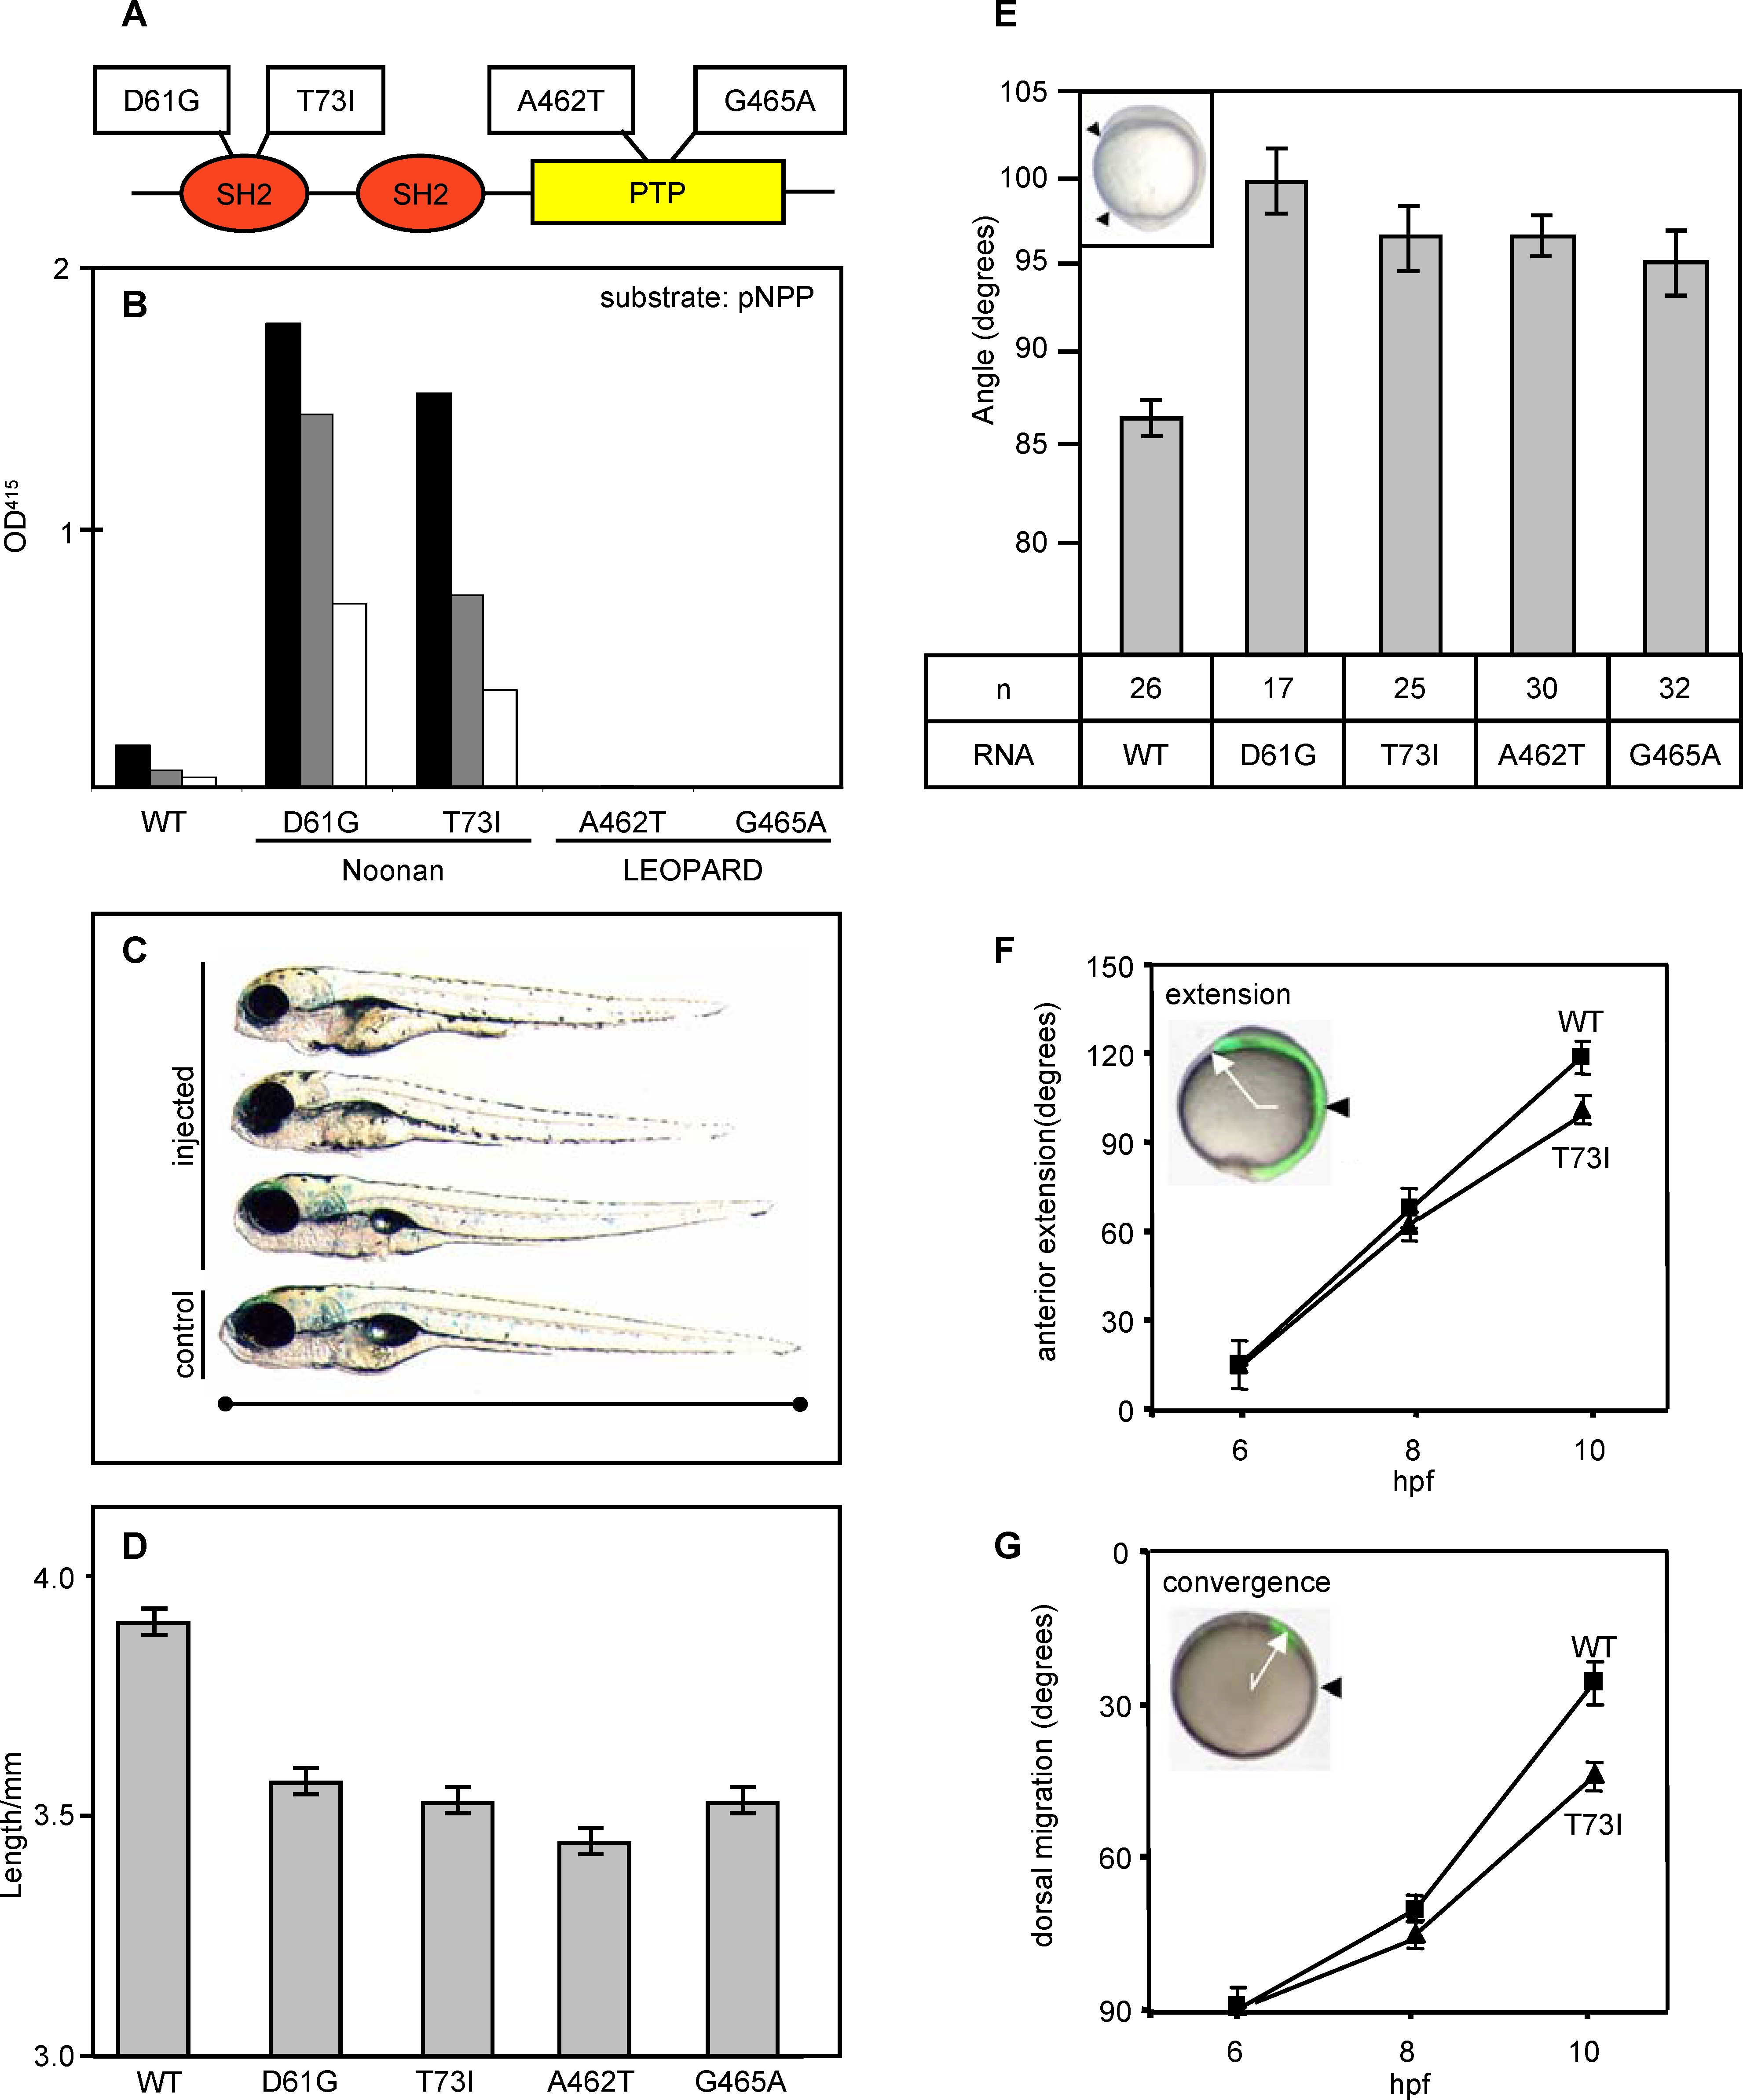
NS and LS Mutant Shp2 Expression Induced CE Cell Movement Defects during Gastrulation
(A) Schematic representation of zebrafish Shp2 with the NS and LS mutations indicated.
(B) PTP activity of WT Shp2, NS (D61G and T73I) and LS (A462T and G465A) mutant Shp2 was assayed using p-nitrophenylphosphate and quantified spectrophotometrically. Each experiment was done with three different amounts of GST-fusion protein (black bar, high; grey bar, middle; and white bar, low).
(C) NS- and LS-Shp2 expression reduced zebrafish embryo body length. Three injected embryos (D61G, 150pg) at 4 dpf are depicted with a noninjected control embryo at the bottom. The figure is representative of defects associated with all NS- and LS-Shp2 expressing embryos.
(D) The length of the embryos was measured at 4 dpf and the average is shown here. Two tailed student t-tests indicate a significant decrease in length after injection of each NS or LS RNA ( p < 0.001).
(E) NS- and LS-Shp2 RNA injection results in reduced extension of the body axis at 10 hpf. The angle between the most anterior and posterior embryonic structure (arrowheads in inset) was determined at the one-somite stage and the average angle is depicted here in degrees. Two tailed student t-tests indicate a significant increase in the angle after injection of NS or LS RNA (p < 0.001). The number of embryos used here is indicated (n).
(F, G) Cell tracing was done as described in Figure 2. NS-Shp2 (T73I) was coinjected with caged fluorophore at the one-cell stage and after uncaging at 6 hpf, extension and convergence were determined at 8 hpf and 10 hpf in ten embryos per condition.