
|
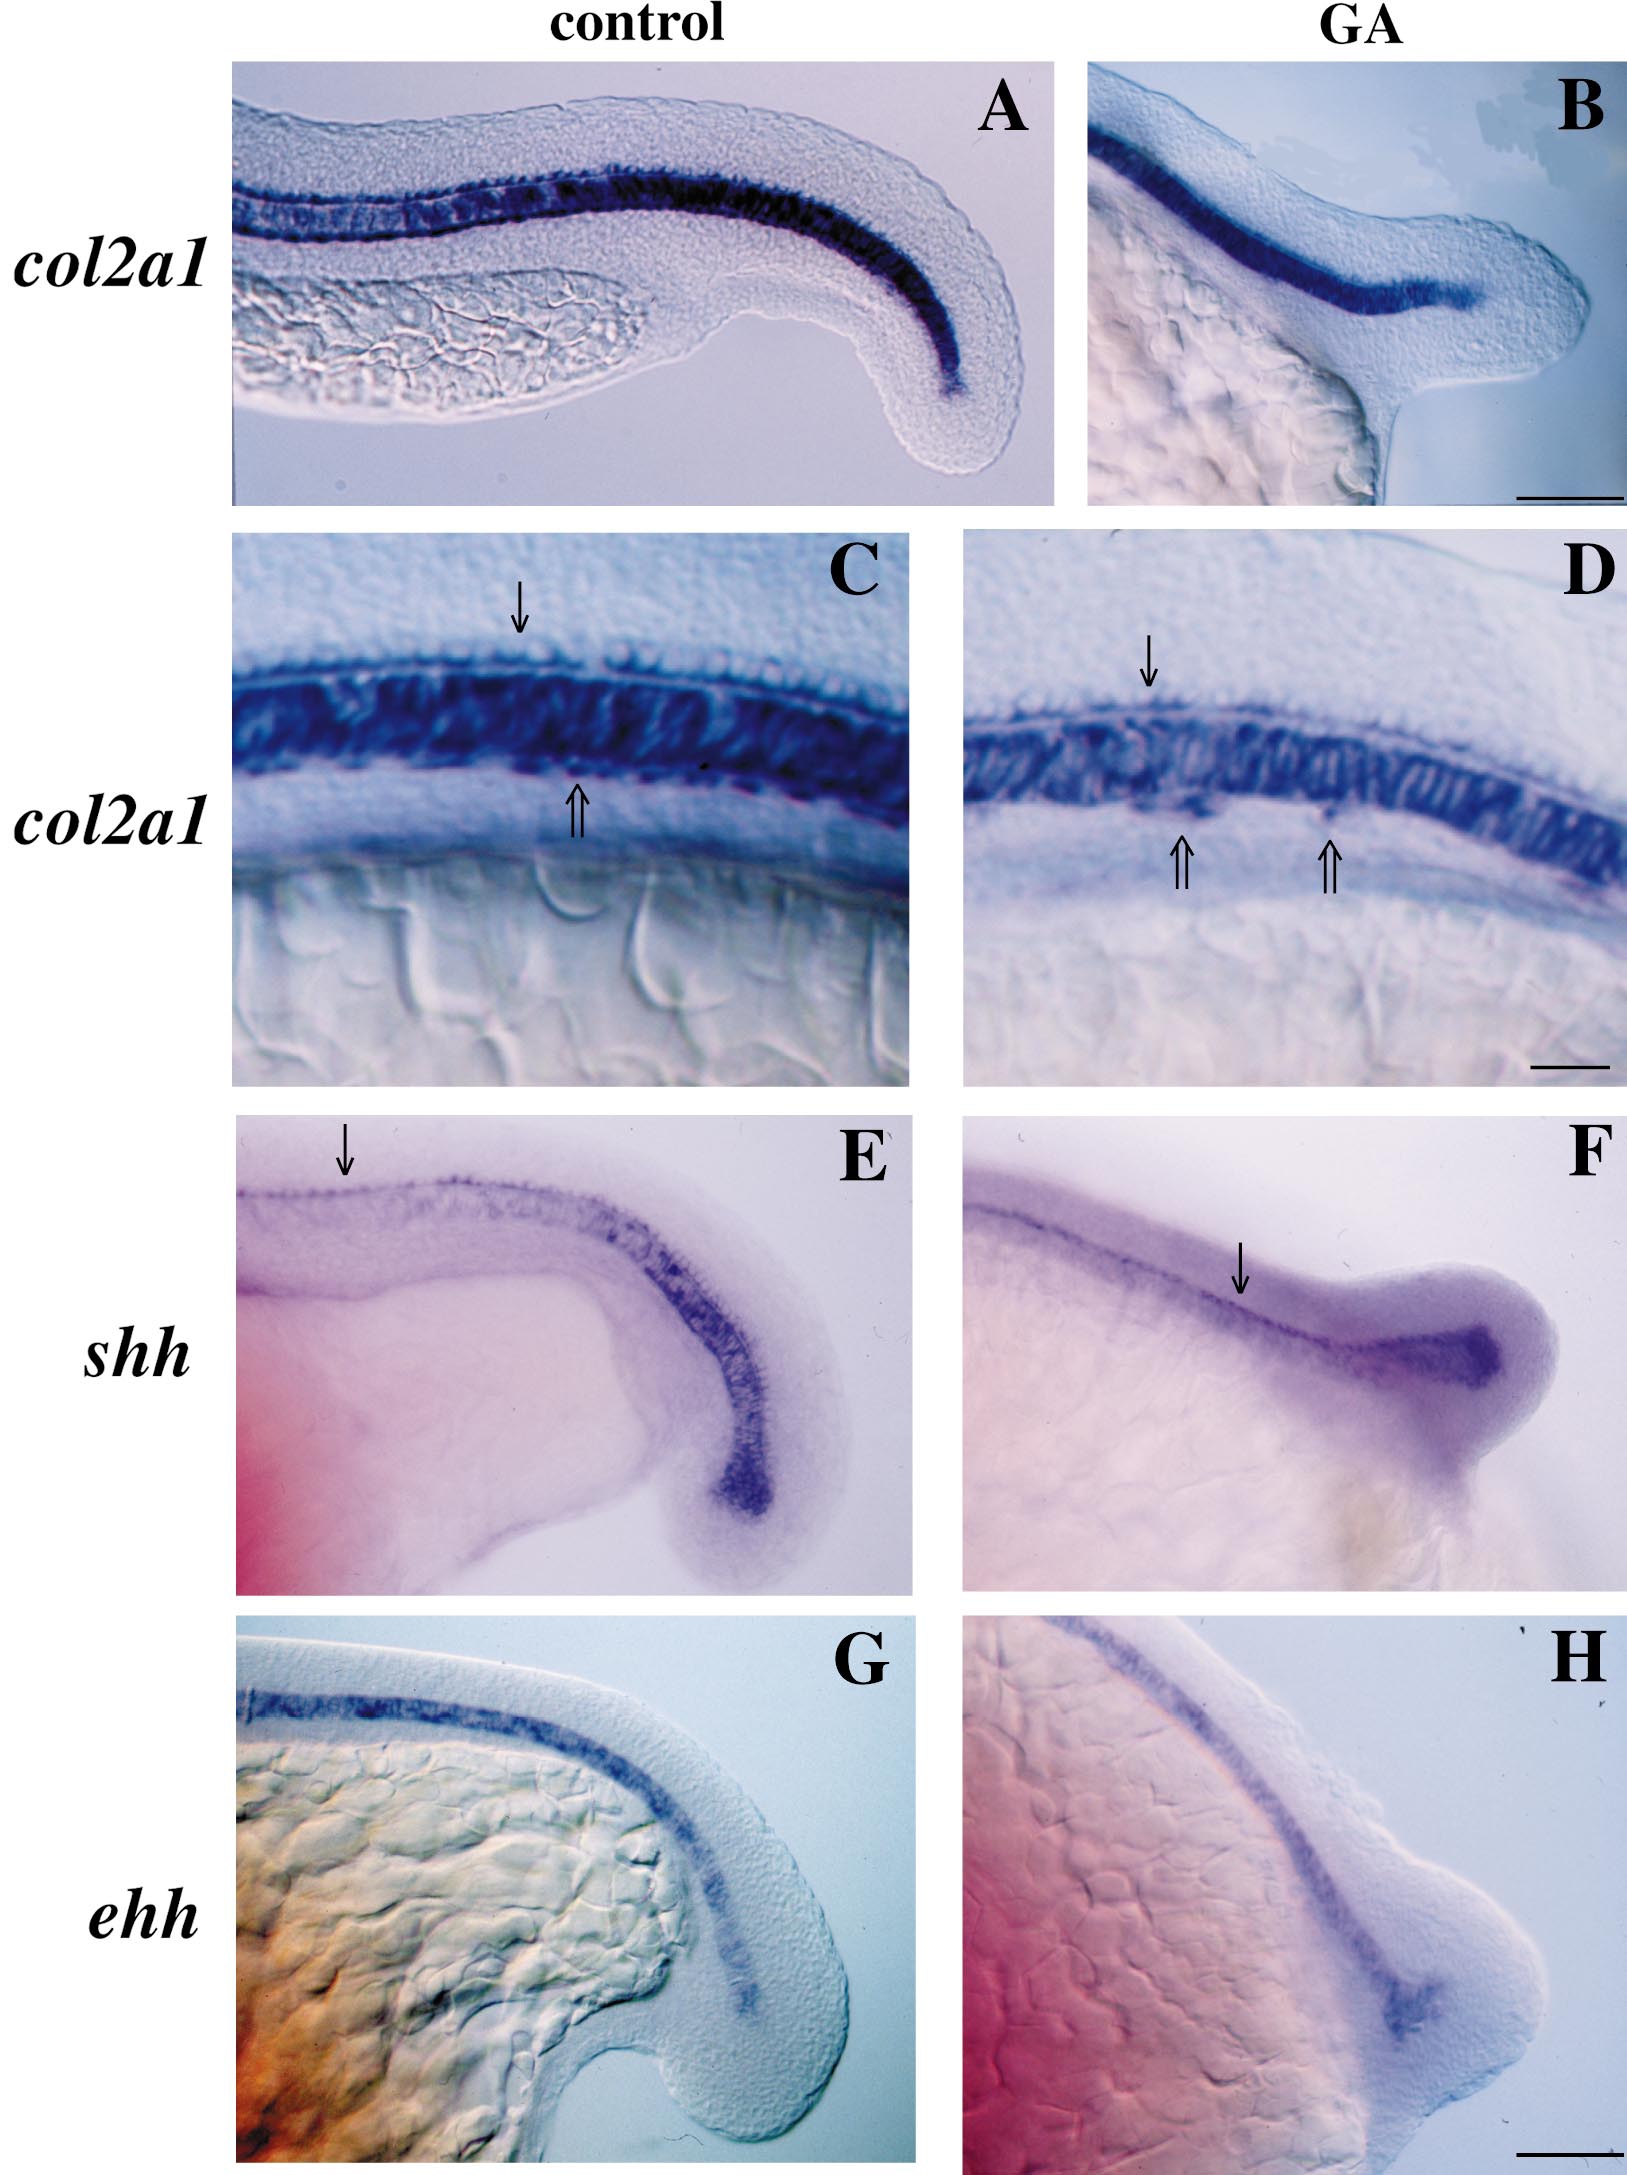
Fig. 6 Expression of notochord and floor plate markers is normal in GA-treated embryos as detected using whole-mount in situ hybridization. (A, C, E, and G) Control. (B, D, F, and H) GA treatment beginning at 50% epiboly. (A–D) col2a1 mRNA. (E and F) shh. (G and H) ehh. Anterior is to the left and dorsal to the top in all. All three markers were expressed normally in the notochord of GA-treated embryos as were other markers of notochord formation such as axial and ntl (data not shown). As well, a single, uninterrupted row of floor-plate cells which express both col2a1 and shh developed immediately above the notochord in both control and GA-treated embryos (arrows in C–F). However, treated embryos exhibited large gaps in the row of col2a1-expressing hypochord cells (open arrows in D) which normally lie as a continuous row immediately below the notochord (open arrow in C). Control embryos in A and C are at the 23- to 24-somite stage and 15-somite stage in E and G. GA-treated embryos are the same age as control embryos. Scale bar in A, B, and D–G, 100 μm. Scale bar in B and C, 50 μm.
Reprinted from Developmental Biology, 210(1), Lele, Z., Hartson, S.D., Martin, C.C., Whitesell, L., Matts, R.L., and Krone, P.H., Disruption of zebrafish somite development by pharmacologic inhibition of hsp90, 56-70, Copyright (1999) with permission from Elsevier. Full text @ Dev. Biol.