
|
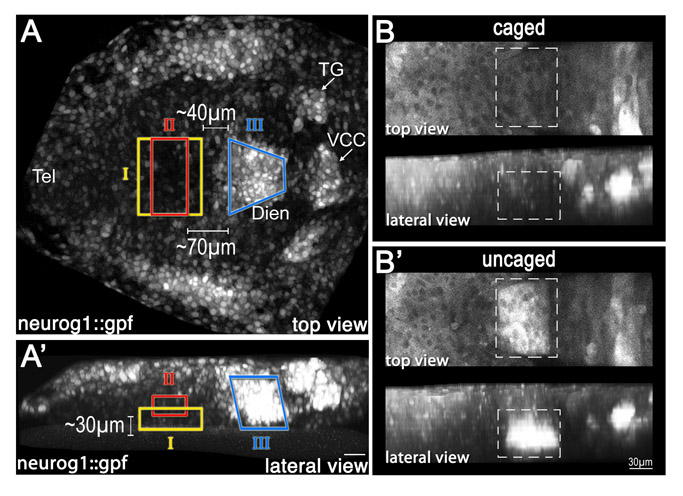
Fig. S3 Positioning of diencephalic progenitor zones in the neural plate determined by the two-photon-based uncaging method. (A,A′) Embryos (anterior to the left) expressing GFP under the control of the neurog1 promoter (neurog1::gfp) were injected with caged dextran-fluorescein tracer dye at the 1-cell stage. At the 1- to 3-somite stage, the dye was uncaged at discrete domains (denoted I, II and III) of the diencephalic anlage. (A) Dorsal view; (A′) lateral view. (B,B′) Projected two-photon z-stack (anterior to the left) of transgenic neurog1::gfp embryo injected with caged fluorescein-dextran (B). The uncaging of the fluorescein tracer at a specific region of interest (dashed box) is visualized in B′. Dien, diencephalon; Tel, telencephalon; TG, trigeminal ganglion; VCC, ventrocaudal cluster.