
|
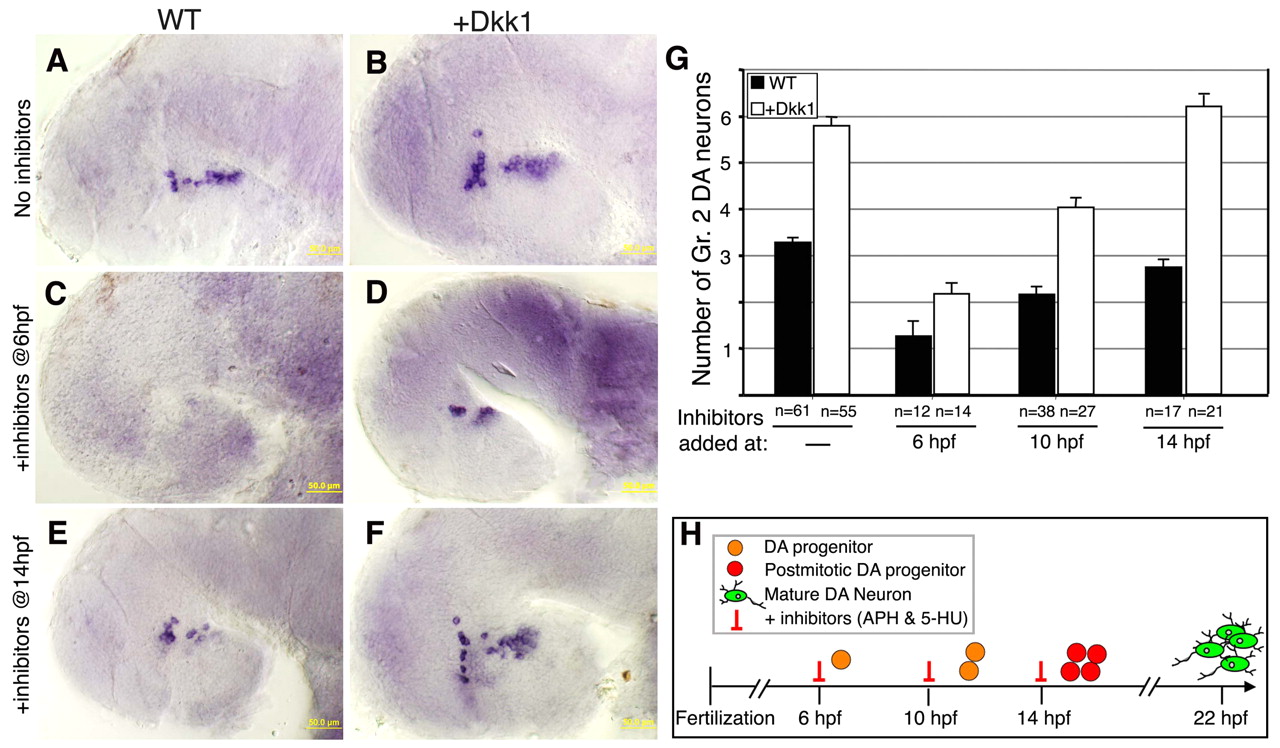
Fig. 6 Temporal inhibition of DA progenitor proliferation. (A-F) Lateral views of Dat+ DA neurons in zebrafish embryos injected with vehicle (WT; A,C,E) or dkk1 mRNA (B,D,F). At the indicated time points, embryos were treated with (A,B) solvent (4% DMSO) or with (C-F) a cell cycle inhibitor cocktail containing aphidicolin (APH, 1 μg/ml) and 5-hydroxyurea (5-HU, 50 mM). DA neurons were counted at 48 hpf. (G) Bar chart showing average cell counts of Dat-expressing DA group 2 (Gr. 2) neurons in wild-type and dkk1-injected embryos. The number of embryos analyzed (n) is shown beneath. (H) Schematic representation of DA progenitor proliferation, deduced from the analysis of DA cell number following temporal inhibition of cell division. Scale bars: 50 μm.