
|
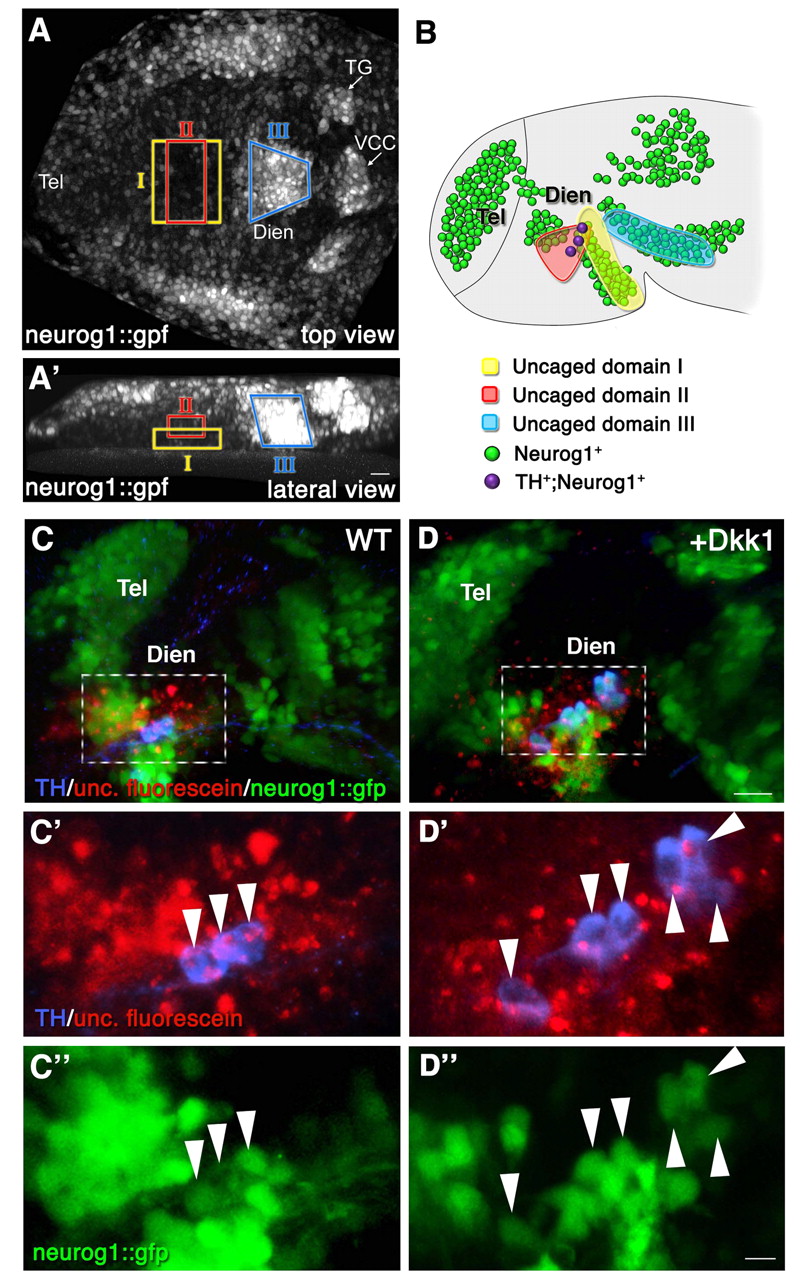
Fig. 3 Fate mapping of the diencephalic progenitor zones. High-resolution fate mapping by two-photon-based uncaging procedure. (A,A') Zebrafish embryos (anterior to the left) expressing GFP under the control of the neurog1 promoter (neurog1::gfp) were injected with caged dextran-fluorescein tracer dye at the 1-cell stage. At the 1- to 3-somite stage, the dye was uncaged at the indicated domains (denoted I, II and III) of the diencephalic anlage. (A) Dorsal view; (A′) lateral view. (B) Schematic summarizing the results of multiple uncaging experiments showing the final destination of the fluorescein-labeled cells in 24-hpf neurog1::gfp embryos. The clones corresponding to each of the uncaged domains are color coded (I, n=6; II, n=6; III, n=10). (C-D″) Control (WT; C-C″) and dkk1 mRNA-injected (D-D″) embryos that underwent uncaging were fixed at 24 hpf, followed by immunofluorescence staining of the uncaged fluorescein and of TH+ DA neurons. High-magnification images of a diencephalic area (dashed boxes in C,D) containing neurog1+ TH+ fluorescein+ triple-positive cells (arrowheads) are shown in C′,C″,D′,D″. Dien, diencephalon; Tel, telencephalon; TG, trigeminal ganglion; VCC, ventrocaudal cluster. Scale bars: 25 μm in A-D; 50 μm in C′,C″,D′,D″.