
Image
|
Figure Caption
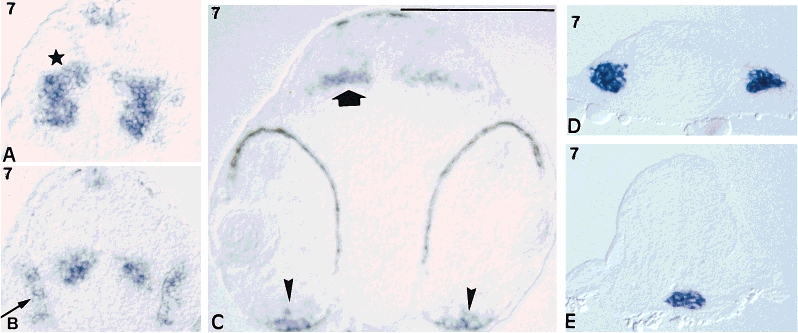
Fig. 7 Analysis of nrd expression in cross-sections reveals a selective pattern confined to specific cell lineages. A: 36 hours postfertilization (hpf), anterior forebrain; star, staining in the telencephalic area. B: 36 hpf; arrow, olfactory placode. C: 36 hpf; arrow, ventral retina; arrowheads, optic tectum. D: 24 hpf; hindbrain, staining in acoustic ganglia. E: 24 hpf; anterior spinal cord, ventral staining in the developing pancreas. Scale bar = 100 μm.
Figure Data
Acknowledgments
This image is the copyrighted work of the attributed author or publisher, and
ZFIN has permission only to display this image to its users.
Additional permissions should be obtained from the applicable author or publisher of the image.
Full text @ Dev. Dyn.