
|
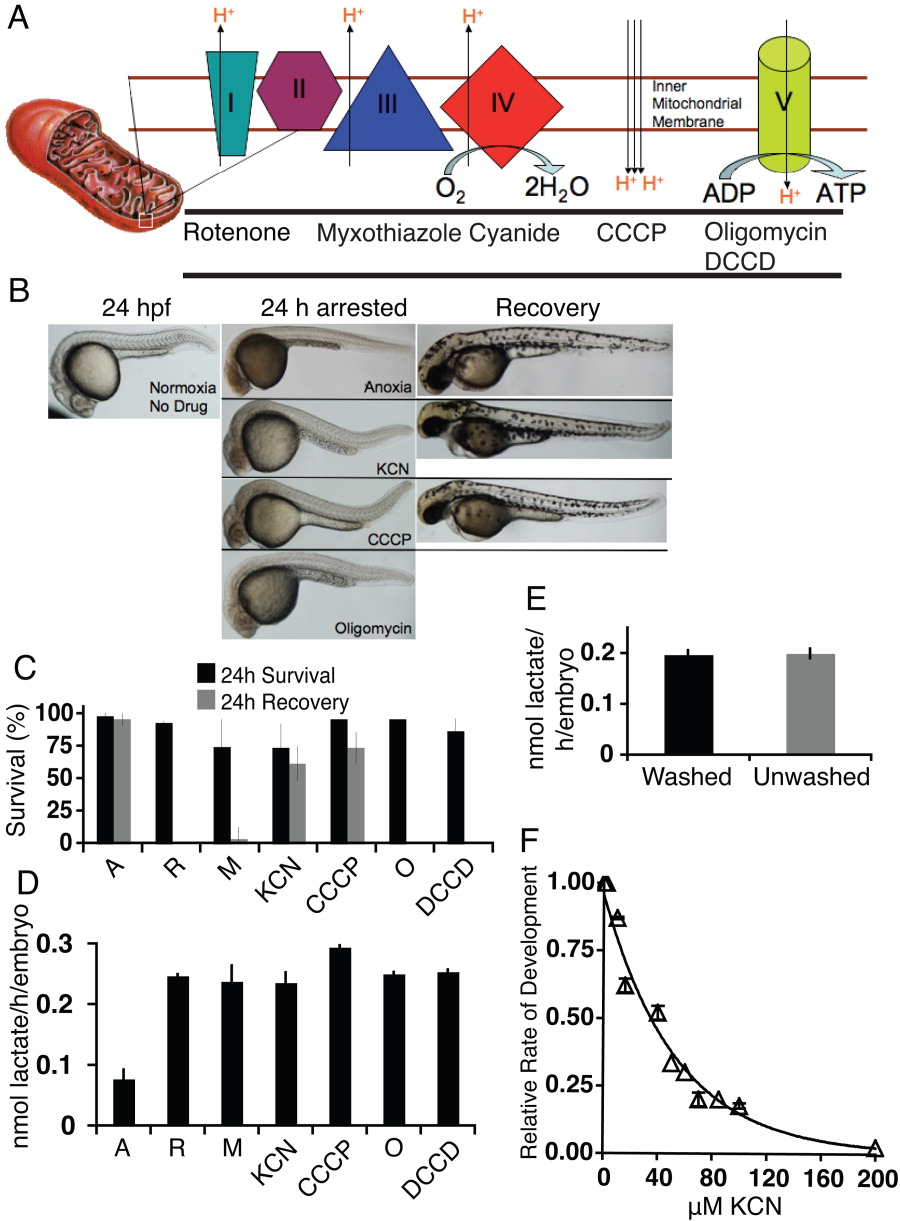
Fig. 4 Anoxic arrest is mimicked by chemical inhibition of oxidative phosphorylation. A: Schematic of the electron transport chain indicating the sites of action of mitochondrial inhibitors. B: Images comparing embryos incubated in anoxia or various inhibitors for 24 hr, and then the same embryos after 24-48 hr of recovery after a return to normoxia or washing of the chemical inhibitor. C: The percent survival after 24 hr of anoxia or treatment with chemical inhibitors beginning at 24 hours post fertilization (hpf) and the percent recovery after an additional 24 hr was measured. A, anoxia; R, rotenone; M, myxothiazole; O, oligomycin. D: Rate of lactate accumulation in 24 hpf embryos after 8 hr in different mitochondrial inhibitors or anoxia. E: Four hours postfertilization embryos were incubated for 1 hr in 10 μM oligomycin, were washed or left in the drug for 17 additional hr, and the rate of lactate accumulation was determined. F: Embryos at 5 hpf placed into varying doses of KCN were incubated for 24 hr after which the relative rate of growth was determined as described in the Experimental Procedures section. The best-fit line describes an exponential decline (R2 = 0.99). All experiments were performed at 24°C. All error bars are ±SD.