
|
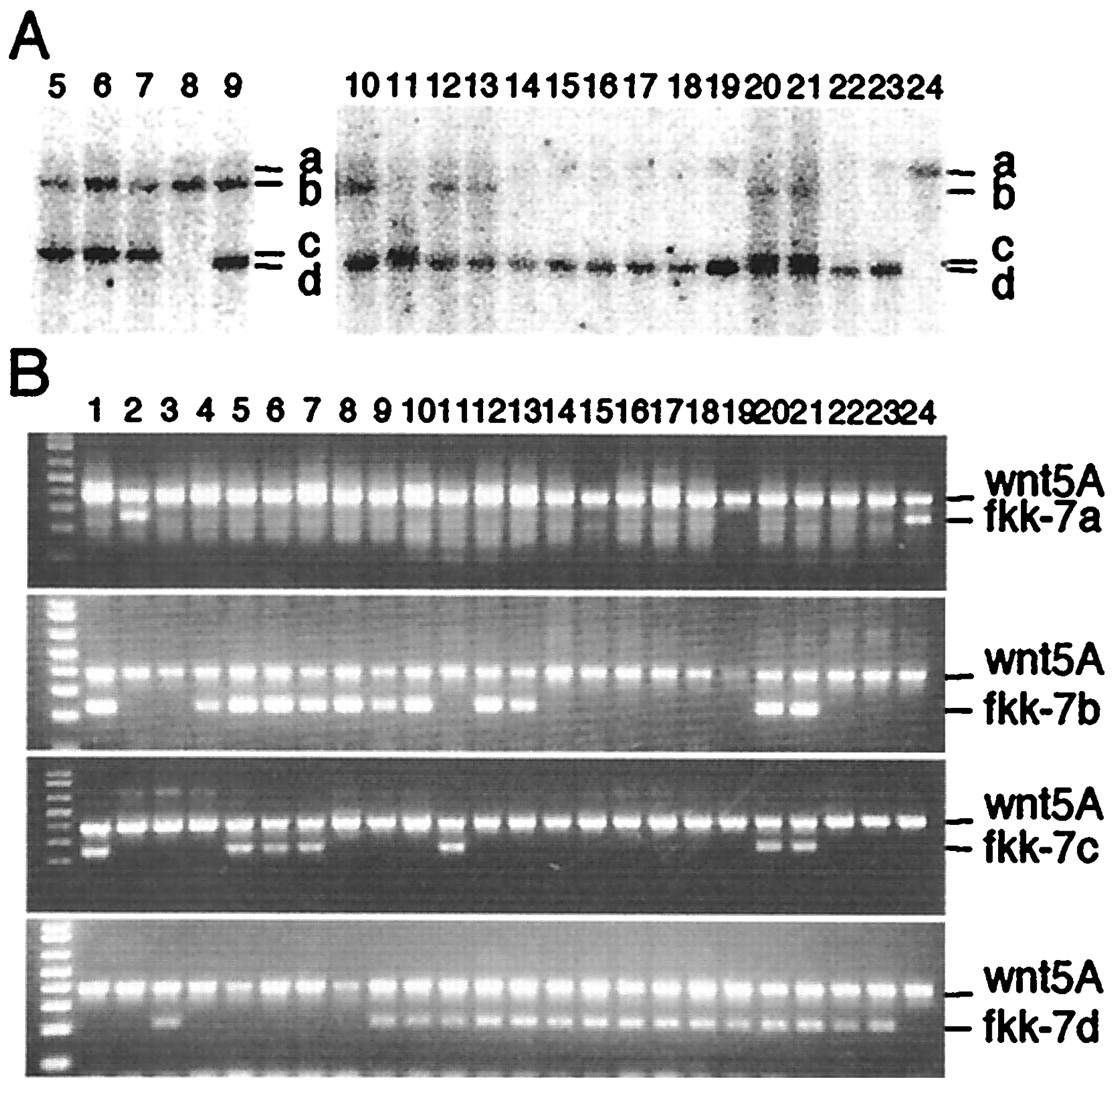
Fig. 4 Identification of the Tol2 insertions in F1 fish. (A) Southern hybridization analysis of F1 fish from fkk-7. DNA samples from 20 F1 fish were digested with EcoRI and hybridized with the probe (Fig. 1). The numbering of the lanes (fish) is continued from Fig.2 C. Bands of four different sizes, a (lane 24), b (lanes 5-10, 12, 13, 20, 21), c (lanes 5-7, 11, 20, 21), and d (lanes 9-23), were detected. The lower bands on lanes 11, 20, and 21 are doublets. (B) PCR analysis of 24 F1 fish from fkk-7. DNA samples on lanes 1-4 correspond to those on lanes 1-4 of Fig. 2C. PCR reactions were carried out using the wnt5A primers (positive control) and 7a3′ and Tol2f20 (fkk-7a), 7b5′ and Tol2r1 (fkk-7b), 7c3′ and Tol2f20 (fkk-7c), or 7d5′-2 and Tol2r1 (fkk-7d). On these photos, the presence of the lower band indicates that the fish carries the specific Tol2 insertion. The results are consistent with those obtained by Southern hybridization analysis and are summarized in Table 1.