
Fig. 2
- ID
- ZDB-IMAGE-080613-31
- Publication
- Langenberg et al., 2008 - The eye organizes neural crest cell migration
- All Figures
- Figures for Langenberg et al., 2008
|
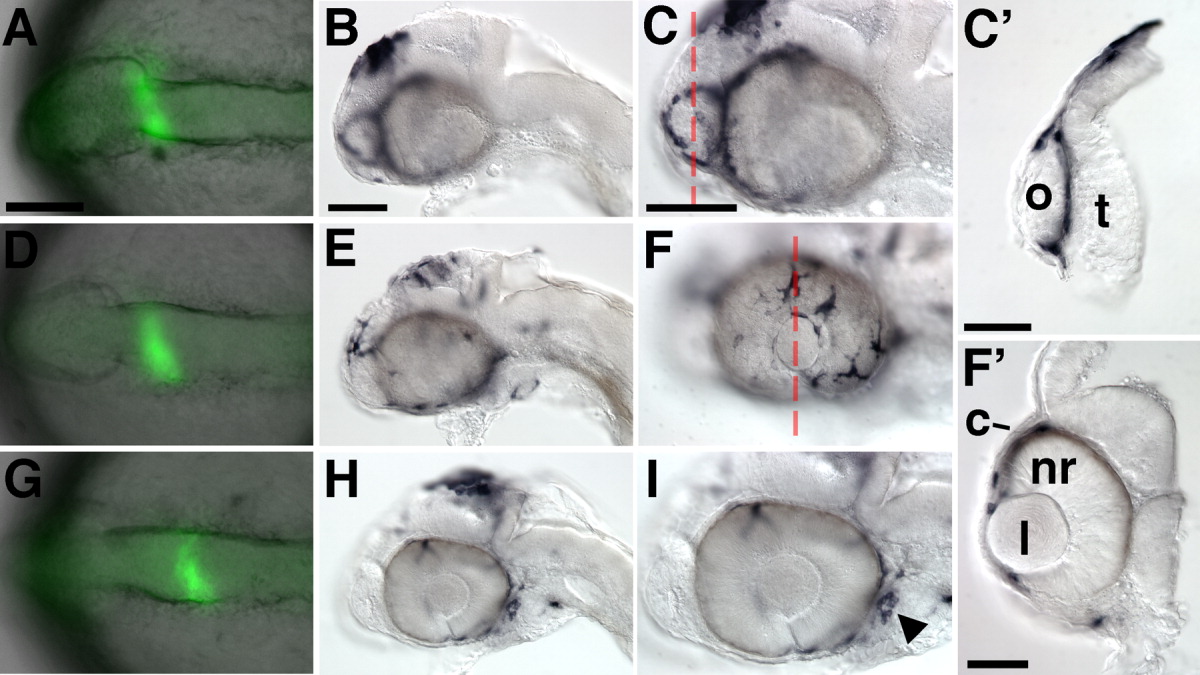
Fig. 2 Fate mapping of diencephalic and mesencephalic neural crest cells (NCCs). A,D,G: Live embryos at 6- to 8-somite stage (ss), immediately after uncaging, showing overlay of brightfield and uncaged fluorescein (green). Fluorescent signal is enhanced to stand out against background. Dorsal views, anterior to the left. B,C,E,F,H,I: Embryos at 36 hours postfertilization (hpf), labeled with anti-fluorescein antibody. Except for C′ and F′ all images are lateral views, anterior to the left. A-C,C′: Diencephalic label. C′: Cross-section through the telencephalon and olfactory placode (o) of the embryo in C. D-F: Mesencephalic label. F′: Cross-section through one eye of the embryo in F. Fluorescein positive NCCs are located between the corneal epithelium (c) and the neural retina (nr). G-I: Posterior mesencephalic label. NCCs in BA1 are marked by the arrowhead. c, corneal epithelium; l, lens; nr, neural retina; o, olfactory placode; t, telencephalon. Scale bars = 100 μm in A,D,G, 100 μm in B,E,H, 50 μm in C,F,I.