
Fig. 1
- ID
- ZDB-IMAGE-080613-30
- Genes
- Publication
- Langenberg et al., 2008 - The eye organizes neural crest cell migration
- All Figures
- Figures for Langenberg et al., 2008
|
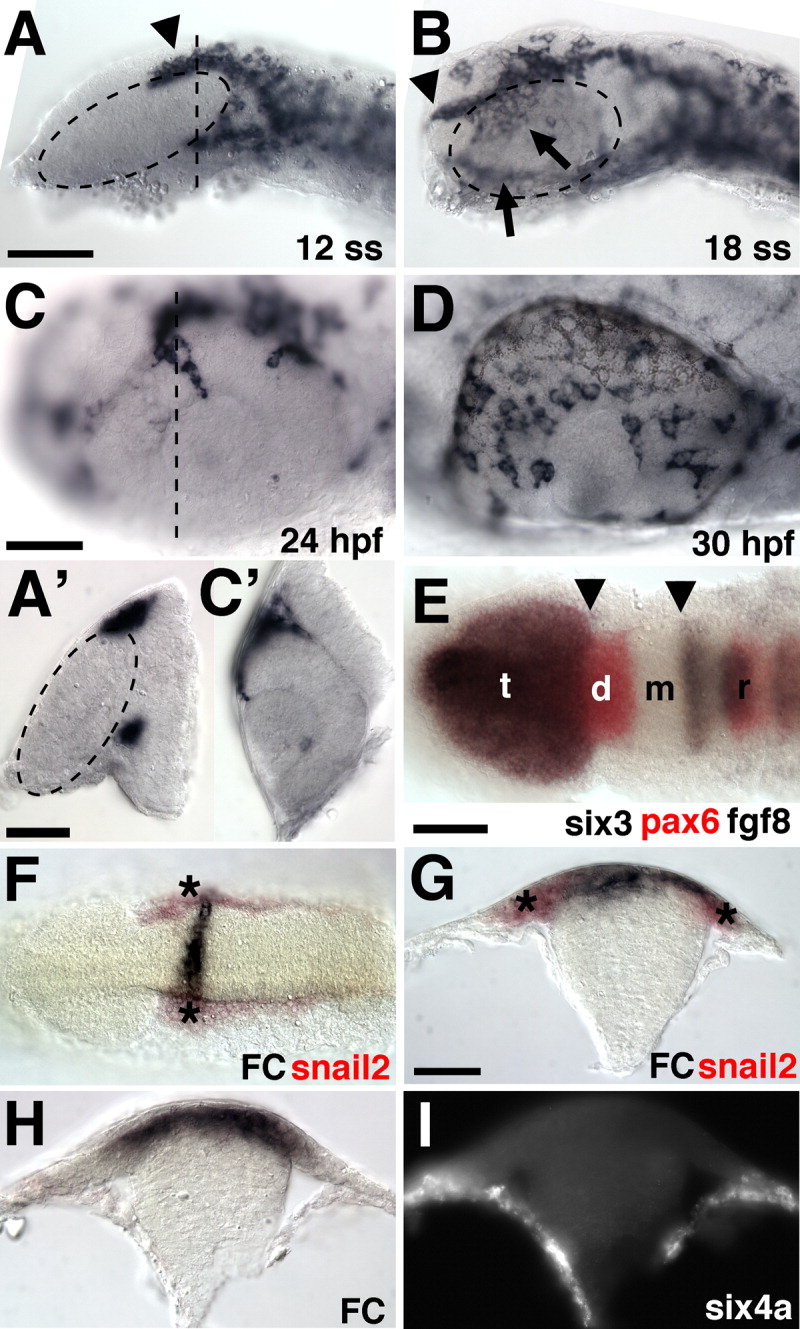
Fig. 1 Anterior neural crest localization and uncaging method. A-D: In situ hybridization for crestin at the indicated stages. Anterior is to the left, dorsal is up. A′ and C′ are cross-sections of A and C, respectively, sectioned at the dotted lines. Arrowheads point to the dorsal anterior stream of neural crest cells (NCCs), arrows to the medial and ventral populations. The hatched oval outlines the eye. E: Double in situ hybridization for the indicated genes. Dorsal view, anterior to the left. Arrowheads mark the boundaries of the regions uncaged for fate mapping. t, telencephalon; d, diencephalon; m, mesencephalon; r, rhombencephalon. F-I: Controls showing that NCCs and not lateral plate mesoderm were uncaged. Uncaged fluorescein (FC) stained black. F,G: Dorsal view (F) and (G) cross-section (G) showing uncaged fluorescein (black) and snail2 expressing NCCs (red, asterisks). I: Fluorescent in situ hybridization for six4a, which is masked by the bright background in H. G-I are cross-sections. Scale bars = 100 μm in A,B, 50 μm in C,D, 25 μm in A′,C′, 100 μm in E,F, 50 μm in G-I.