
Image
|
Figure Caption
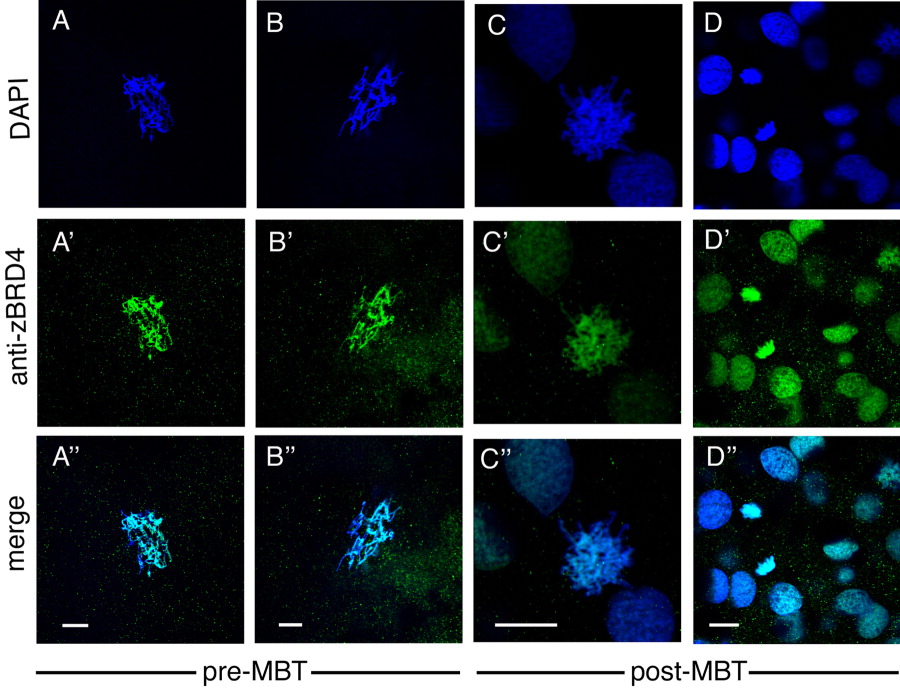
Fig. 5 Localization of endogenous Brd4 protein visualized by staining with anti-zebrafish Brd4 antibody. A-A″,B-B″: Pre-midblastula transition (MBT, 256-512 cell stage) embryos. C-C″,D-D″: Post-MBT (sphere to dome stage) zebrafish embryos. A-C: Prophase. Scale bar = 10 μm.
Figure Data
Acknowledgments
This image is the copyrighted work of the attributed author or publisher, and
ZFIN has permission only to display this image to its users.
Additional permissions should be obtained from the applicable author or publisher of the image.
Full text @ Dev. Dyn.