
Fig. 4
- ID
- ZDB-IMAGE-080606-4
- Publication
- Ma et al., 2001 - Production of zebrafish germ-line chimeras from embryo cell cultures
- All Figures
- Figures for Ma et al., 2001
|
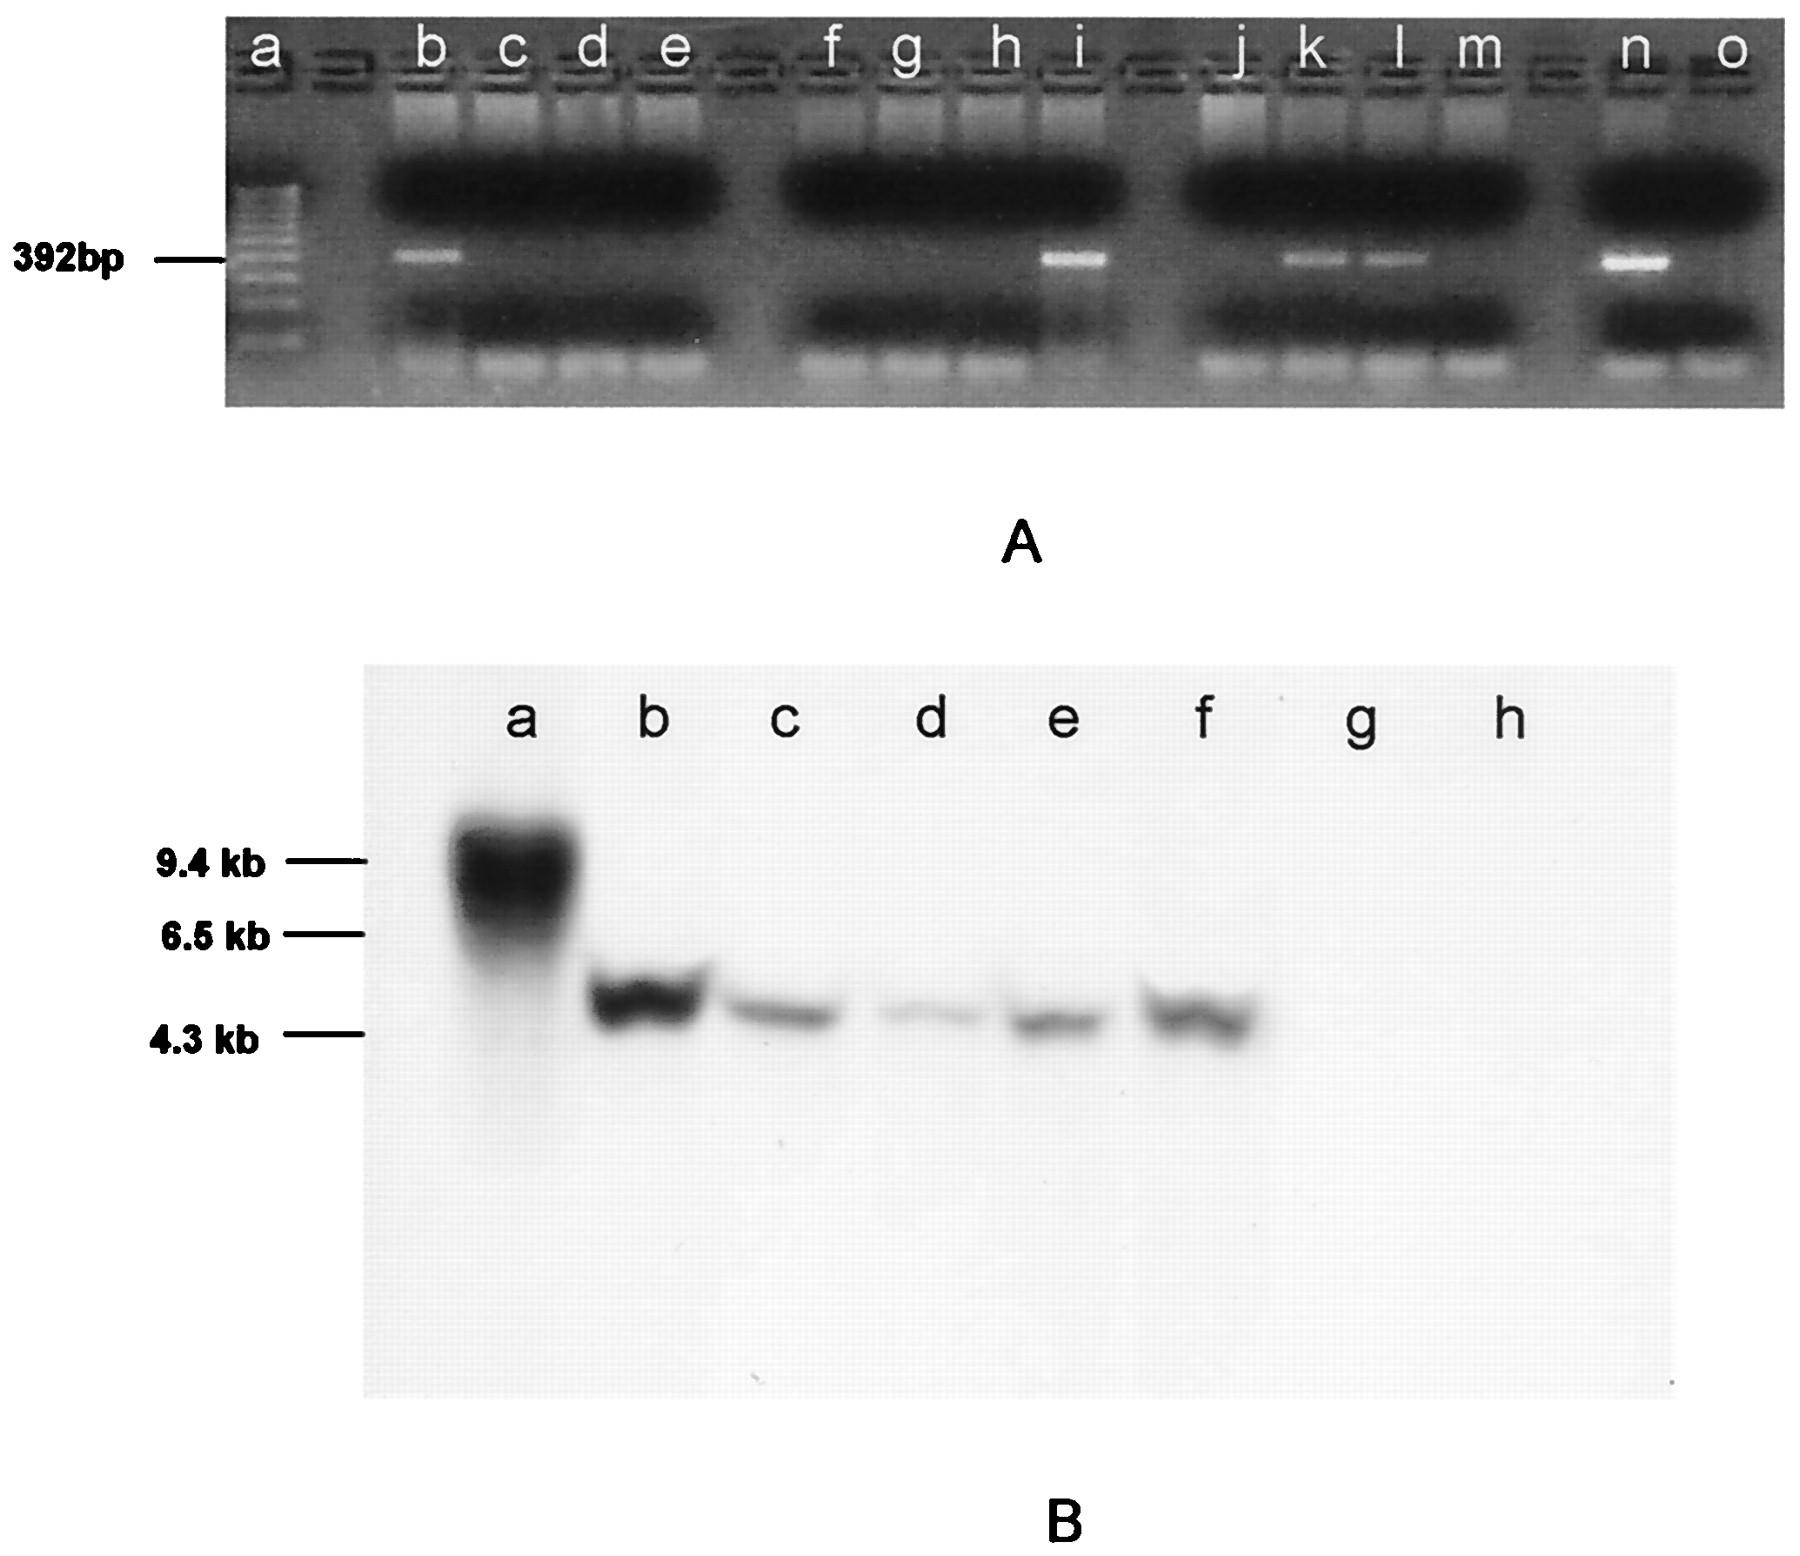
Fig. 4 PCR (A) and Southern blot analysis (B) of genomic DNA showing the presence of neo sequences. (A) Genomic DNA isolated from individual F1 fish (lanes b-m) produced from a single spawning of GASSI fish that were injected as embryos with cultured cells and bred with noninjected GASSI individuals. DNA was amplified with neo-specific primers designed to generate a 392-bp product. Product identity was confirmed by sequencing. neo sequences were detected in lanes b, i, k, and l. Lanes a, n, and o are molecular weight markers, positive control (neo-containing plasmid template) and negative control (no template), respectively. (B) Southern blot analysis of genomic DNA by using a neo-specific probe. The same integration pattern for neo sequences was observed in DNA isolated from B7-43 fish (lane b), cell cultures derived from B7-43 embryos (lane c), individual F1 fish (lanes d and e) obtained from a GASSI chimera that was injected at the blastula stage with cultured B7-43 embryo cells and bred with a noninjected GASSI fish, and an F2 individual (lane f) obtained by breeding positive F1 siblings. Lane a, DNA isolated from fish embryo cells transfected in culture with neo-containing plasmid showing a different integration pattern. Lanes g and h, DNA isolated from a GASSI fish and another nontransgenic line of zebrafish.