
IMAGE
Fig. S9
- ID
- ZDB-IMAGE-080605-8
- Publication
- Sidi et al., 2008 - Chk1 Suppresses a Caspase-2 Apoptotic Response to DNA Damage that Bypasses p53, Bcl-2, and Caspase-3
- All Figures
- Figures for Sidi et al., 2008
Image
|
Figure Caption
Fig. S9
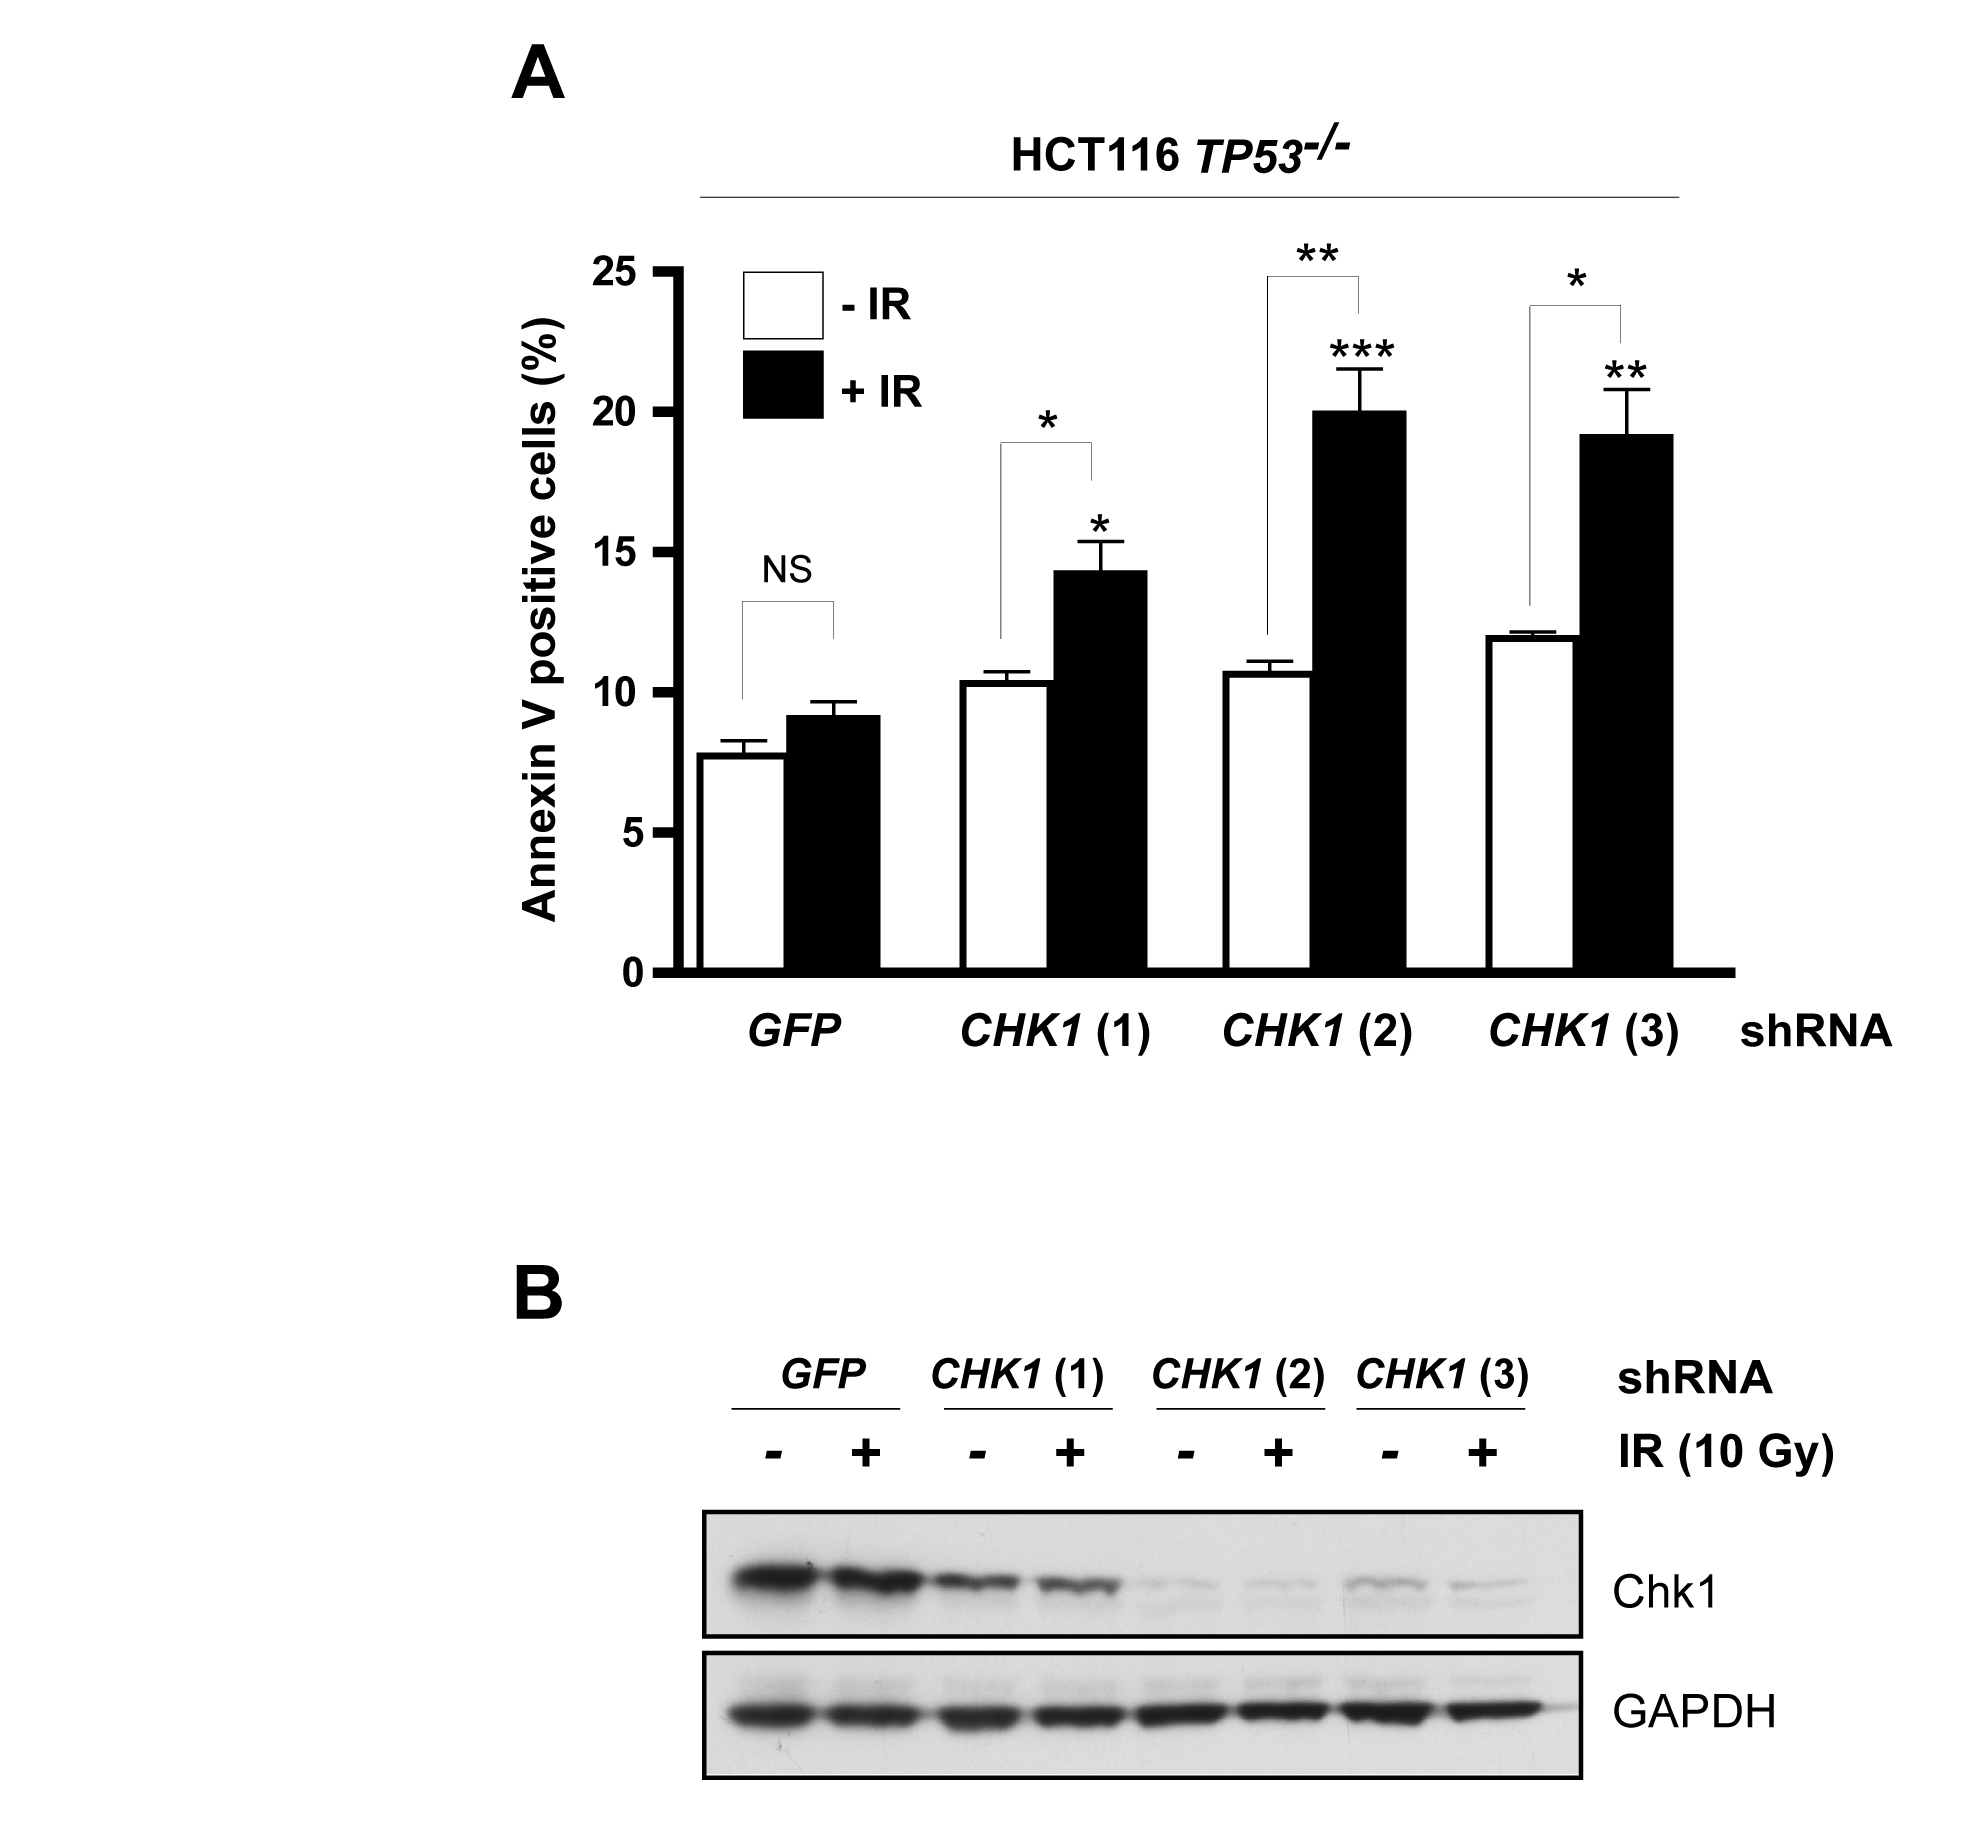
CHK1 shRNAs phenocopy Gö6976 in HCT116 cells
(A) Apoptotic cell numbers at 48 hpIR as measured by Annexin V (+) / PI (-) staining of cell lines expressing the indicated shRNAs. Cells were treated with 0 or 10 Gy IR (white and black bars, respectively). All data are reported as means ± SEM. Asterisks on top of bars refer to comparisons with GFP shRNA + IR. * P<0.05; ** P<0.01; *** P<0.005 (two-tailed Student’s t-test).
(B) Western blot comparing the levels of Chk1 in 24-hpIR lysates from the experiment shown in panel A.
Acknowledgments
This image is the copyrighted work of the attributed author or publisher, and
ZFIN has permission only to display this image to its users.
Additional permissions should be obtained from the applicable author or publisher of the image.
Reprinted from Cell, 133(5), Sidi, S., Sanda, T., Kennedy, R.D., Hagen, A.T., Jette, C.A., Hoffmans, R., Pascual, J., Imamura, S., Kishi, S., Amatruda, J.F., Kanki, J.P., Green, D.R., D'Andrea, A.A., and Look, A.T., Chk1 Suppresses a Caspase-2 Apoptotic Response to DNA Damage that Bypasses p53, Bcl-2, and Caspase-3, 864-877, Copyright (2008) with permission from Elsevier. Full text @ Cell