
Fig. S5
- ID
- ZDB-IMAGE-080605-5
- Genes
- Antibodies
- Publication
- Sidi et al., 2008 - Chk1 Suppresses a Caspase-2 Apoptotic Response to DNA Damage that Bypasses p53, Bcl-2, and Caspase-3
- All Figures
- Figures for Sidi et al., 2008
|
Fig. S5
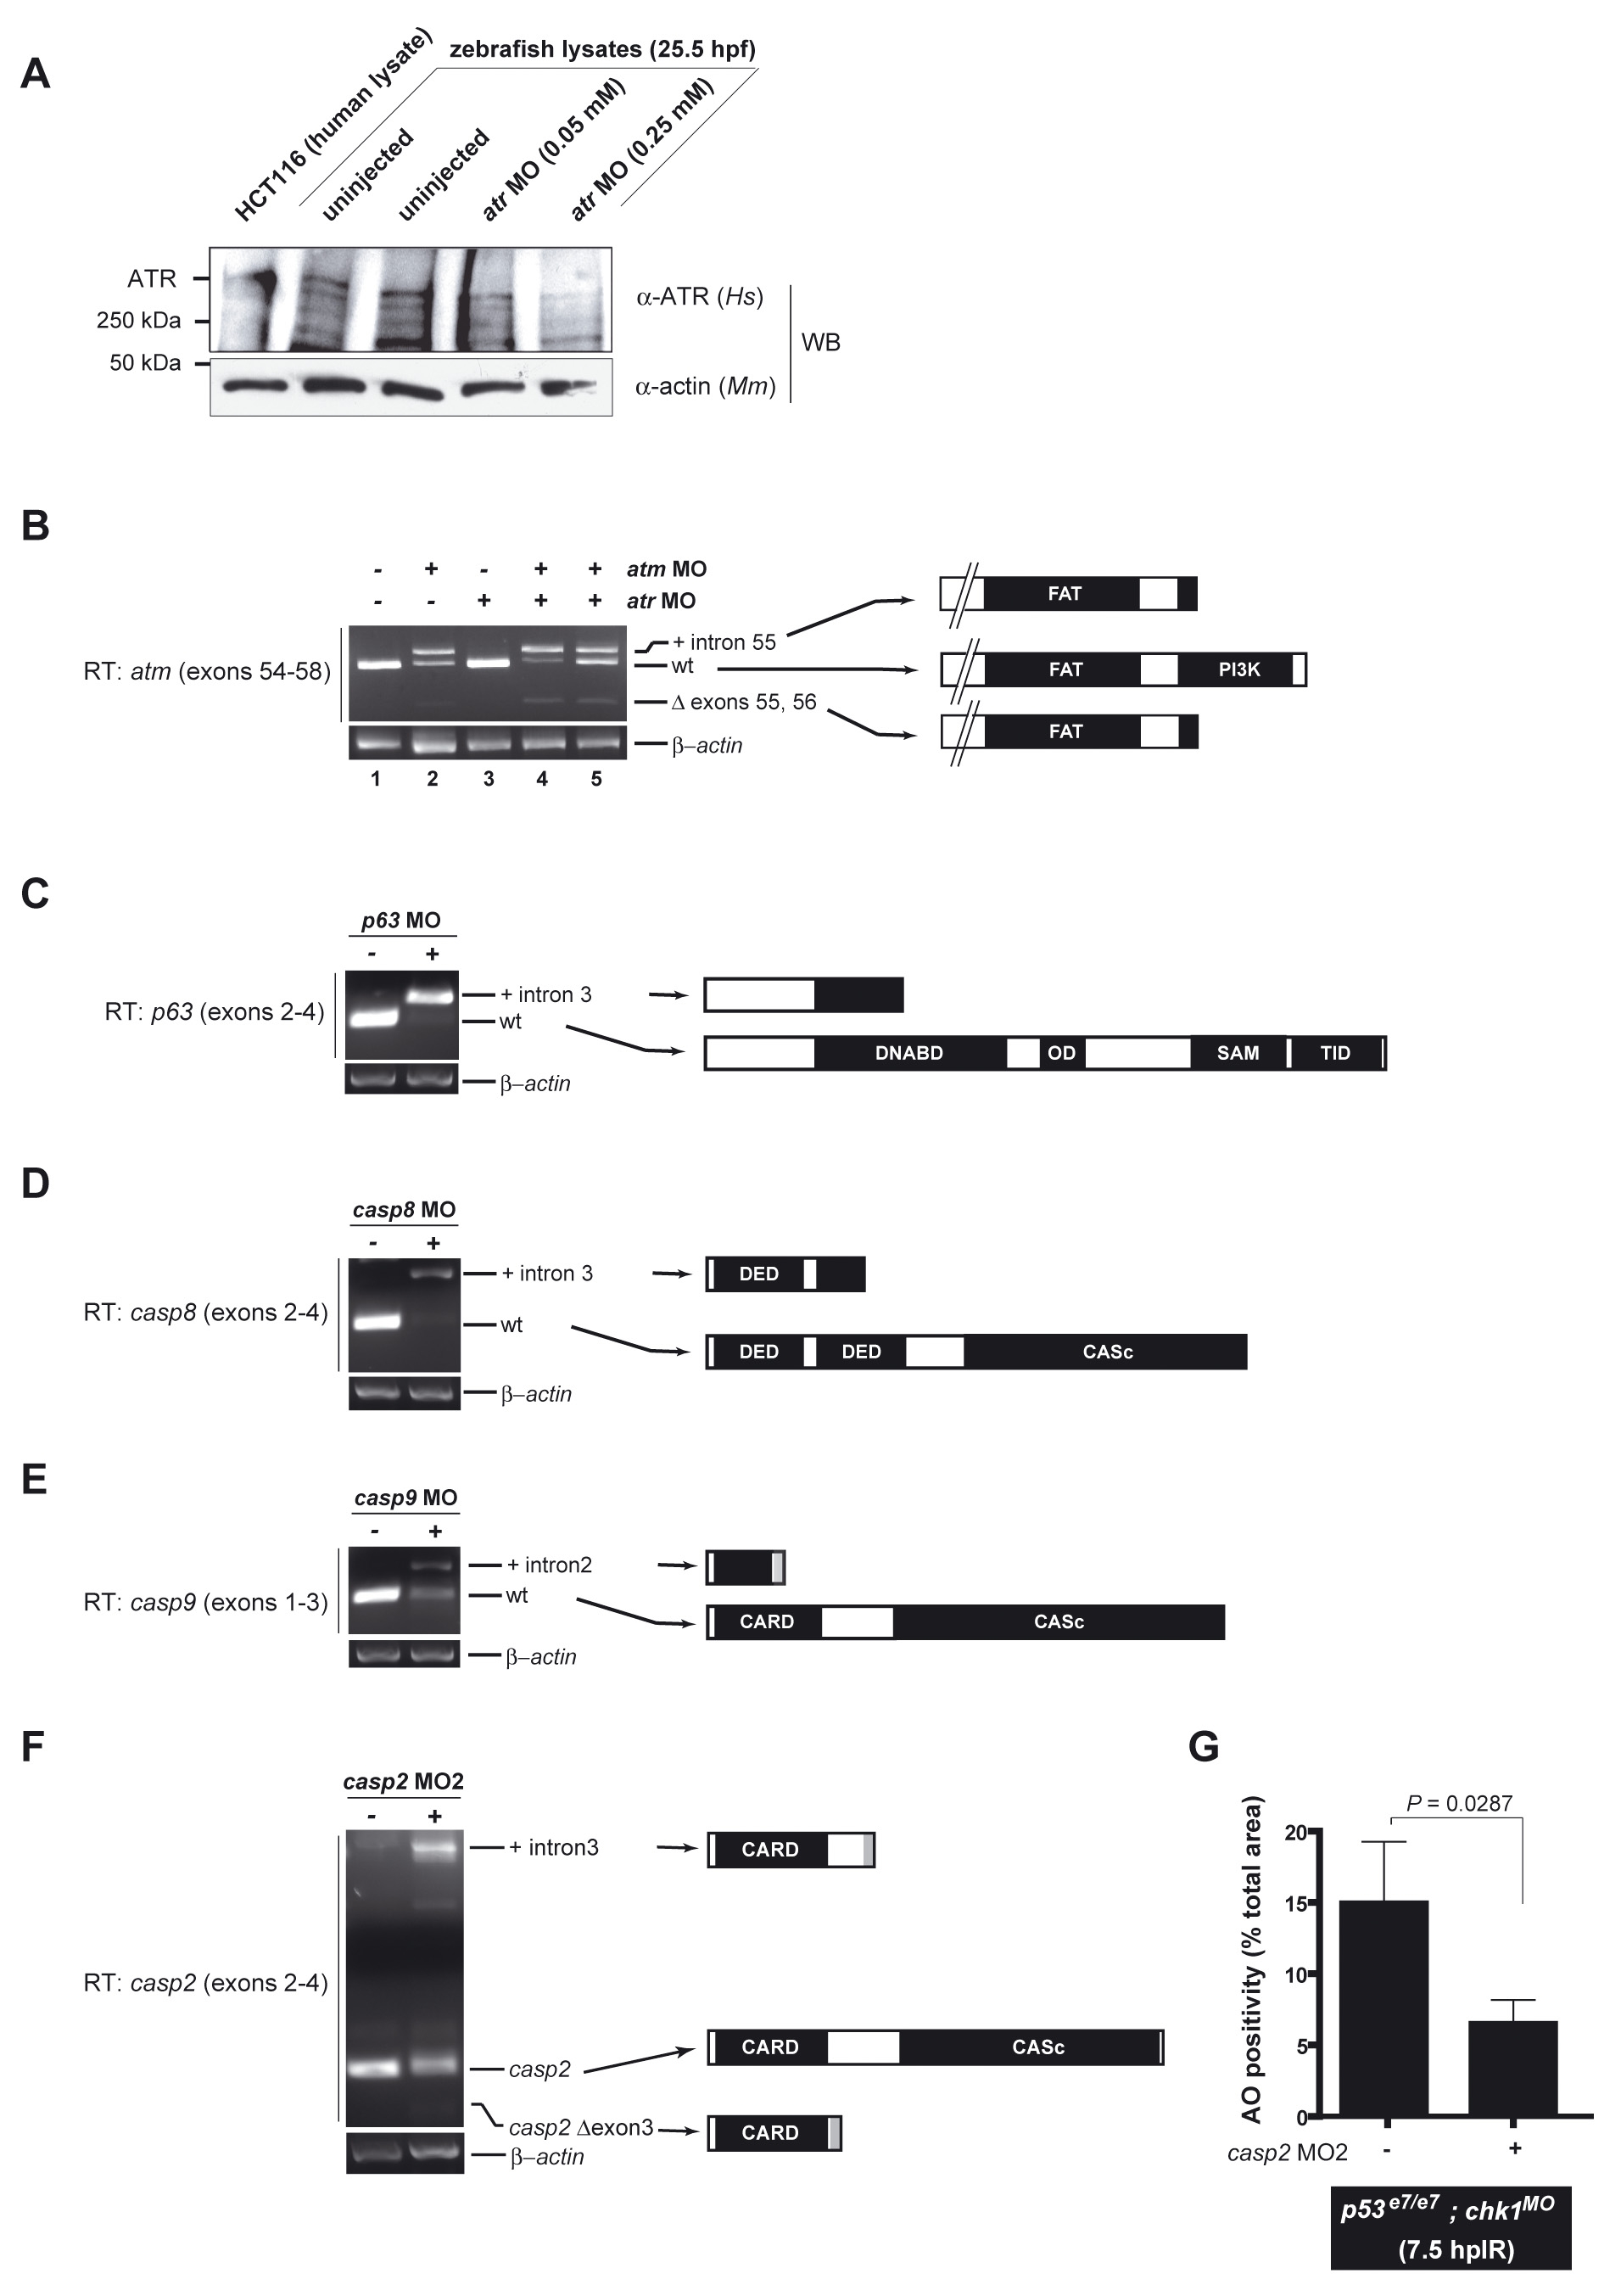
Knockdown efficiencies of selected MOs
(A) Western blot of 25.5 hpf zebrafish protein lysates from non-injected and atr MO-injected embryos using an anti-human ATR antibody recognizing an internal peptide that is highly conserved in zebrafish Atr. Detection of a high molecular weight zebrafish band running similarly to human ATR (lane 1) supports crossreactivity of the antibody with zebrafish ATR (the predicted molecular weight of zebrafish ATR, 300 kDa, matches that of human ATR). Relative band intensities show that the specific atr MO (Stern et al., 2005) knocks downs zebrafish ATR levels in a dose dependent fashion. The MO concentration used in the MO screen (Figure 1) and epistasis analyses (Figure 4), 0.25 mM, leads to a >50% reduction in ATR levels compared to control (compare lanes 5 with 2 and 3).
(B-E) Gel migration profiles of RT-PCR products from non-injected and MO-injected embryos using primers in exons flanking the targeted exon (Table S1; primers sequences are available upon request). All bands were excised and sequenced. Predicted protein products are indicated at the right. All RT-PCRs are semi-quantitative with a β-actin amplicon serving as loading control.
(B) atm. Left primer is located in exon 54, right primer is located in exon 58 (Imamura and Kishi, 2005). The atm MO interferes with splicing at the intron 55/exon 56 splice junction, resulting in either retention of intron 55, deletion of exon 56, or both. Both aberrant splice products result in early stop codons (as a result of in-frame reading of the intron or of a frameshift caused by exon skipping), which is predicted to result in an early truncation of the ATM protein before the PIKK kinase domain. Numbers below the lanes refer to embryo morphology at 18 hpf. 1-3, 5: normal; 4, grossly affected or dead, incompatible with the IR/AO assay. Note that the atm MO concentration used in our study, which is compatible with our IR/AO assay, leads to an incomplete knockdown of atm. As exemplified in lane 4, this same MO concentration could lead to stronger knockdowns, but in this case the embryos could not be scored in the assay.
(C) p63. Left primer is located in exon 2, right primer is located in exon 4. The p63 MO interferes with splicing at the exon3/intron 3 splice junction, resulting in retention of intron 3. This aberrant splice product results in an early stop codon (as a result of in-frame reading of the intron) predicted to result in an early truncation of any p63 protein expressed from the p63 locus before the DNA binding domain (which is essential for the activities of both pro- and anti-apoptotic isoforms of p63). p63 MO strongly depletes the wild-type p63 mRNA pool, with the majority of transcripts retaining intron 3, leading to an efficient gene knockdown.
(D) casp8. Left primer is located in exon 2, right primer is located in exon 4. The casp8 MO interferes with splicing at the exon3/intron 3 splice junction, resulting in retention of intron 3. This aberrant splice product results in an early stop codon (as a result of in-frame reading of the intron), predicted to result in an early truncation of procaspase-8, thus removing part of the second DED domain and the entirety of the catalytic domain. casp8 MO both strongly depletes the wild-type casp8 mRNA pool and attenuates the levels of both wild-type and aberrant splice forms, resulting in a highly efficient gene knockdown.
(E) casp9. Left primer is located in exon 1, right primer is located in exon 3. The casp9 MO interferes with splicing at the exon2/intron 2 splice junction, resulting in retention of intron 2. This aberrant splice product results in an early stop codon (as a result of in-frame reading of the intron), predicted to result in an early truncation of procaspase-9, thus removing part of the CARD domain and the entirety of the catalytic domain. casp9 MO results in an incomplete, ∼50% knockdown, but higher concentrations of the MO were either lethal prior to 18 hpf, or viable but extremely toxic to the embryos, precluding the analysis of epistatic relationships with chk1 and p53.
(E) Gel migration profiles of RT-PCR products from non-injected and casp2 MO2-injected embryos using primers in exons flanking exon 3 (left primer is located in exon 2, right primer is located in exon 4). Predicted protein products are indicated at the right.
(F) Quantified AO responses of irradiated (12.5 Gy) p53e7/e7;chk1MO embryos that were non-injected (left) or injected with casp2 MO2 (right). AO staining was quantified in the spinal cords of ≥9 embryos per condition, with ≥50 embryos scored. The data are reported as means ± SEM. Statistical significance estimated via a two-tailed Student’s t-test.
Reprinted from Cell, 133(5), Sidi, S., Sanda, T., Kennedy, R.D., Hagen, A.T., Jette, C.A., Hoffmans, R., Pascual, J., Imamura, S., Kishi, S., Amatruda, J.F., Kanki, J.P., Green, D.R., D'Andrea, A.A., and Look, A.T., Chk1 Suppresses a Caspase-2 Apoptotic Response to DNA Damage that Bypasses p53, Bcl-2, and Caspase-3, 864-877, Copyright (2008) with permission from Elsevier. Full text @ Cell