
Fig. S2
- ID
- ZDB-IMAGE-080605-2
- Antibodies
- Publication
- Sidi et al., 2008 - Chk1 Suppresses a Caspase-2 Apoptotic Response to DNA Damage that Bypasses p53, Bcl-2, and Caspase-3
- All Figures
- Figures for Sidi et al., 2008
|
Fig. S2
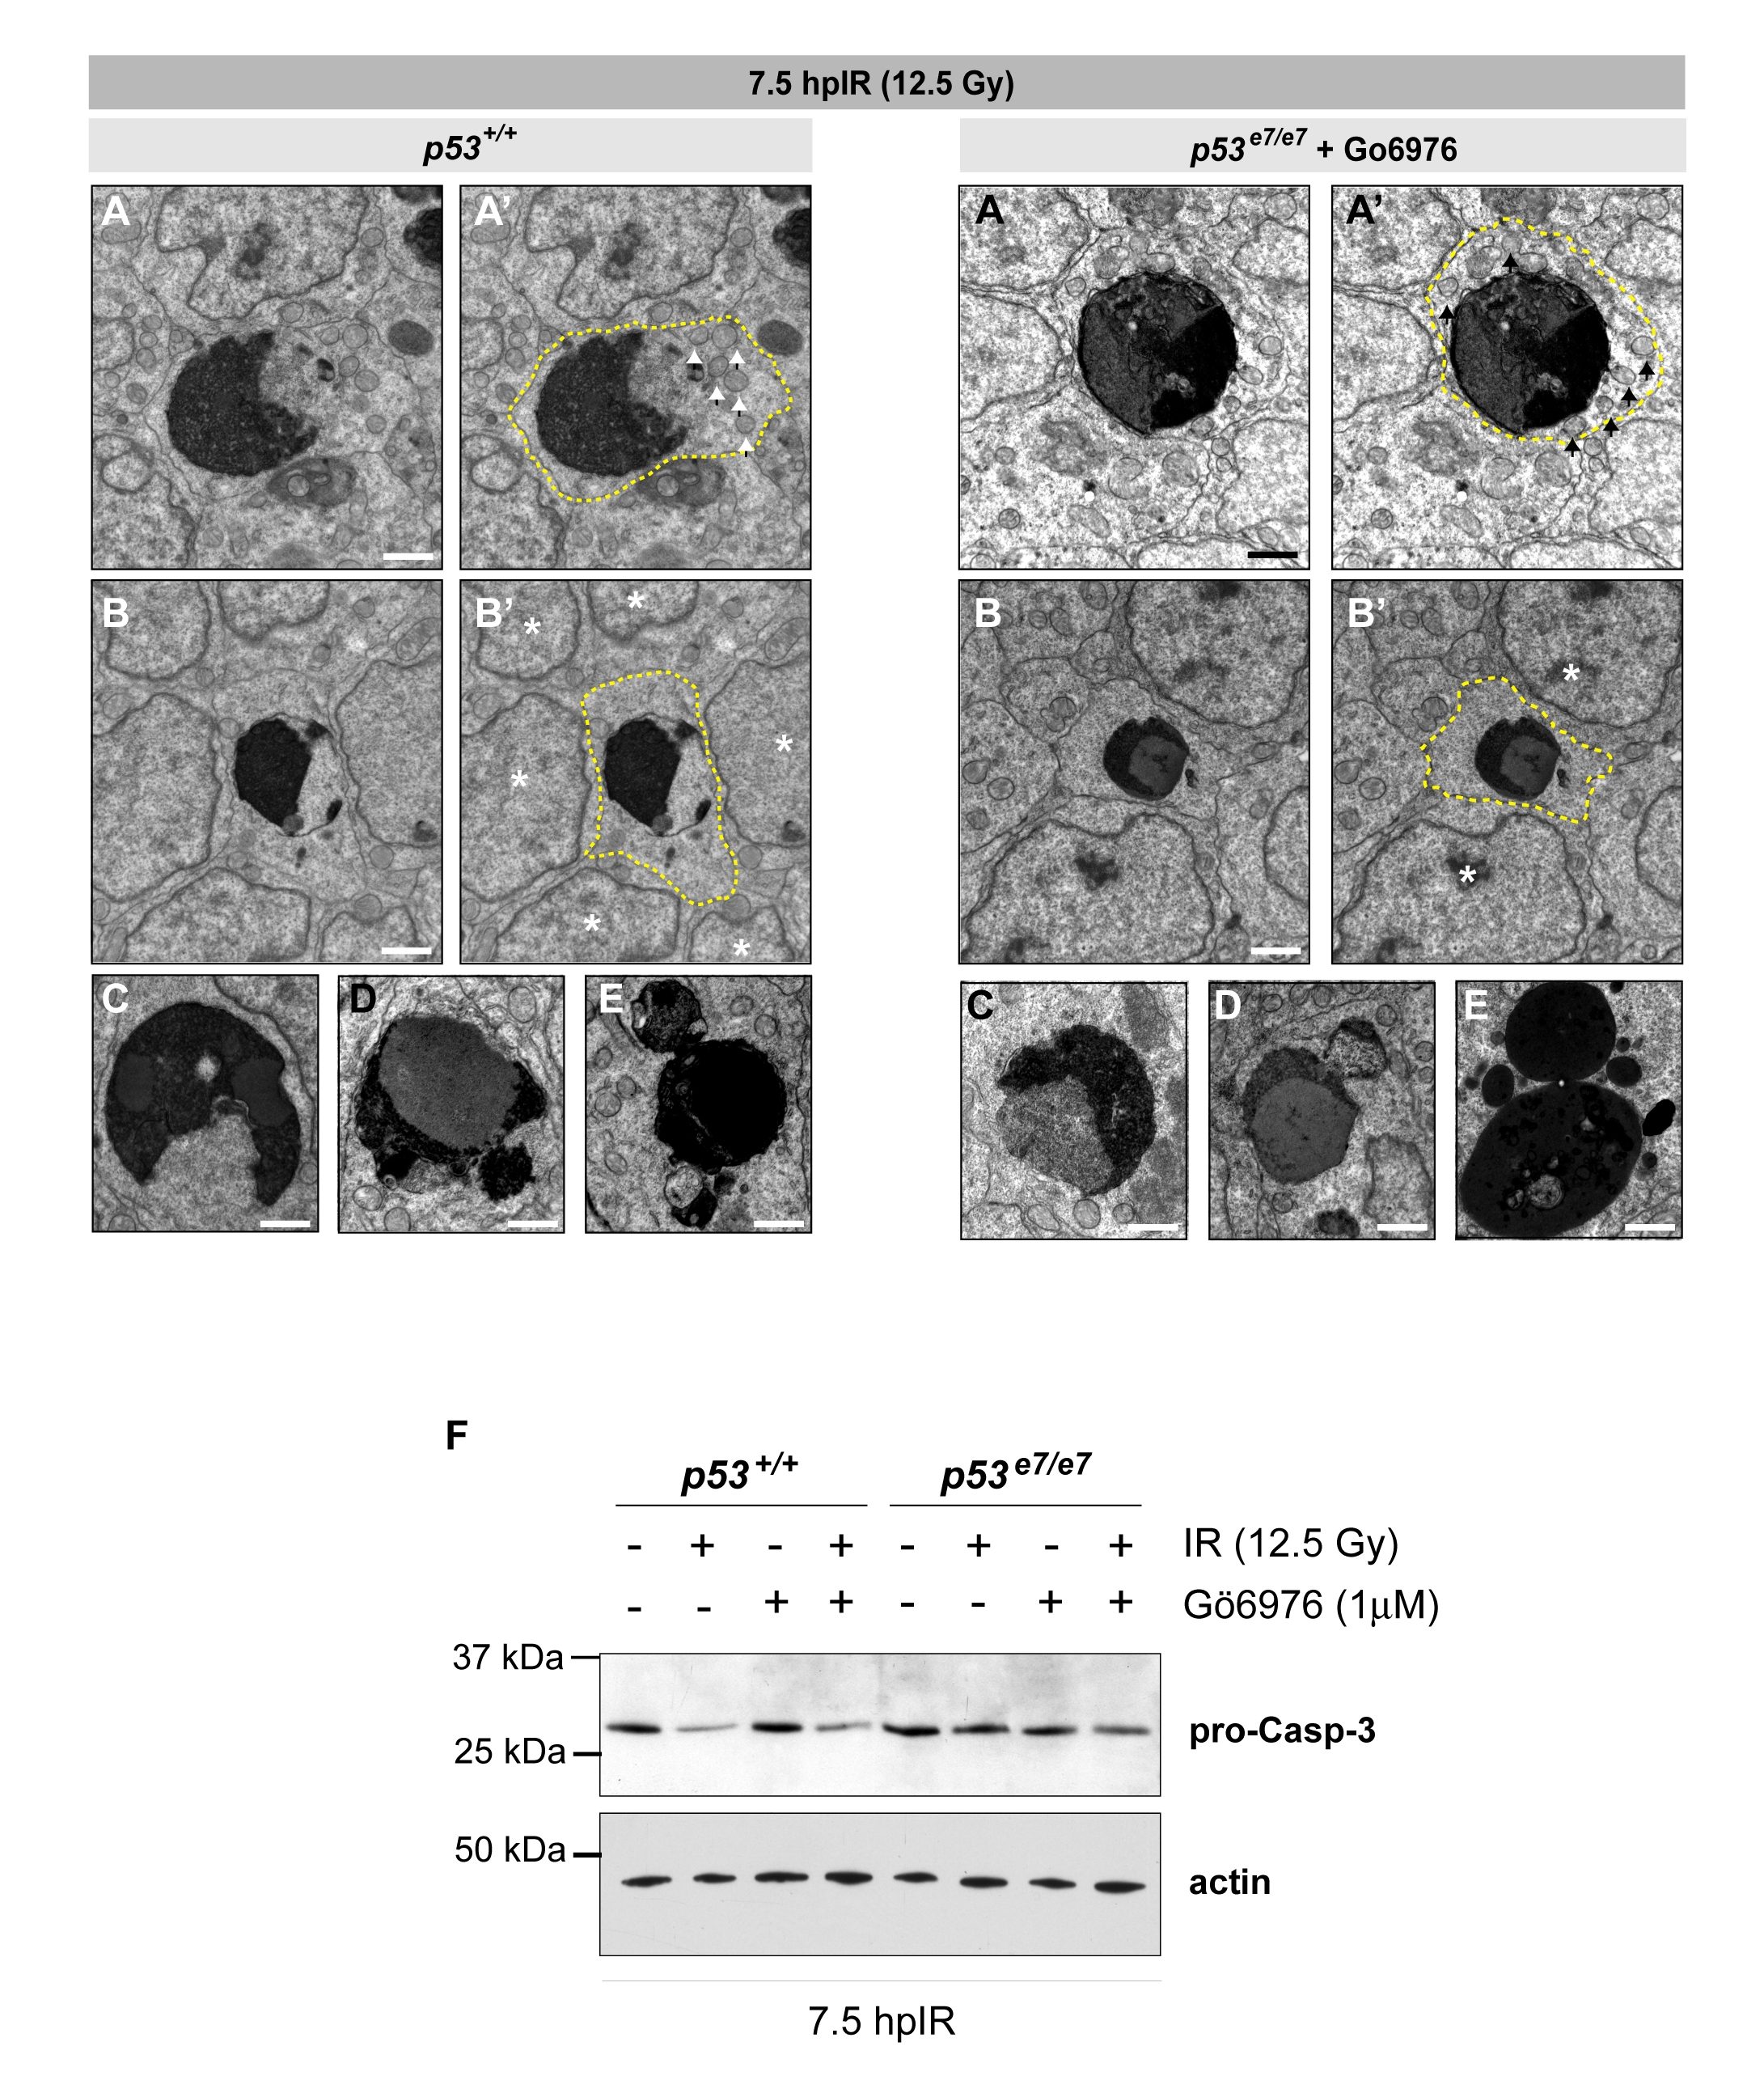
Cytologic hallmarks of apoptosis, but retention of elevated procaspase-3 levels, in irradiated Chk1-inhibited p53e7/e7 embryos
Electron micrographs (sagittal sections) of wild-type versus Chk1-inhibited p53 mutant CNS after 12.5 Gy IR. Gö6976 is a specific Chk1 inhibitor (see Figures 5-7). Cytologic hallmarks of apoptosis (as defined in Wyllie et al., 1980) are shown as follows.
(A) Nuclear chromatin compaction and segregation alongside retention of intact cytoplasmic organelles and plasma membrane (white arrowheads and dashed yellow outline, respectively, in panel A′).
(B) Nuclear chromatin compaction and segregation alongside cytoplasmic condensation. In B′, the plasma membrane is outlined in yellow and the nuclei of surrounding healthy cells are indicated by white asterisks. Compare the size of the apoptotic cell to the size of healthy nuclei.
(C-E) Nuclear morphology of early (C), mid-stage (D) and late stage (E) apoptosis.
(C) Nuclear chromatin compaction and segregation.
(D) Nuclear budding.
(E) Nuclear fragmentation.
Scale bar, 1 μM.
(F) Western blot comparing the levels of procaspase-3 in wild-type versus p53 mutant embryos 7.5 hr after 0 or 12.5 Gy IR in the presence or absence of the Gö6976. Note that IR leads to a significant reduction in procaspase-3 levels in wild-type embryos exposed or not exposed to the inhibitor, as expected from cleavage of the pro-form. In contrast, no such decrease in procaspase-3 levels is observed in isogenic irradiated p53 mutants even after exposure to the inhibitor (lane 8), even though Gö6976 restored IR-induced cell death with complete penetrance in these mutants (Figure 7A). The anti-caspase-3 antibody used in this experiment is the rabbit anti-human caspase-3 pAb from Stressgen (AAS-103) that recognizes procaspase-3 in all species thus far tested, including Xenopus. The band showing reduction in irradiated wild-type embryos migrates between the 25 and 37 kDa markers, consistent with the predicted sizes of zebrafish procaspase-3a and procaspase-3b (31 kDa), strongly supporting cross-reactivity.
Reprinted from Cell, 133(5), Sidi, S., Sanda, T., Kennedy, R.D., Hagen, A.T., Jette, C.A., Hoffmans, R., Pascual, J., Imamura, S., Kishi, S., Amatruda, J.F., Kanki, J.P., Green, D.R., D'Andrea, A.A., and Look, A.T., Chk1 Suppresses a Caspase-2 Apoptotic Response to DNA Damage that Bypasses p53, Bcl-2, and Caspase-3, 864-877, Copyright (2008) with permission from Elsevier. Full text @ Cell