
Image
|
Figure Caption
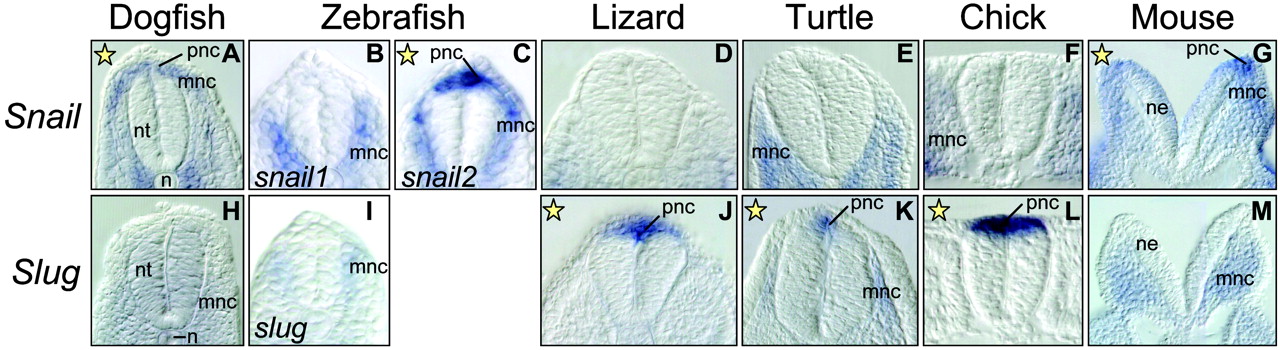
Fig. 4 Sections through the trunk region showing expression of Snail: (A) dogfish; (C) zebrafish snail2; (G) mouse; and expression of Slug: (J) lizard; (K) turtle; and (L) chick in the pnc. Yellow stars indicate those genes expressed in this population in each species. n, notochord; ne, neural epithelium; nt, neural tube.
Acknowledgments
This image is the copyrighted work of the attributed author or publisher, and
ZFIN has permission only to display this image to its users.
Additional permissions should be obtained from the applicable author or publisher of the image.
Full text @ Proc. Natl. Acad. Sci. USA