
Fig. 5
- ID
- ZDB-IMAGE-080604-84
- Publication
- Sidi et al., 2008 - Chk1 Suppresses a Caspase-2 Apoptotic Response to DNA Damage that Bypasses p53, Bcl-2, and Caspase-3
- All Figures
- Figures for Sidi et al., 2008
|
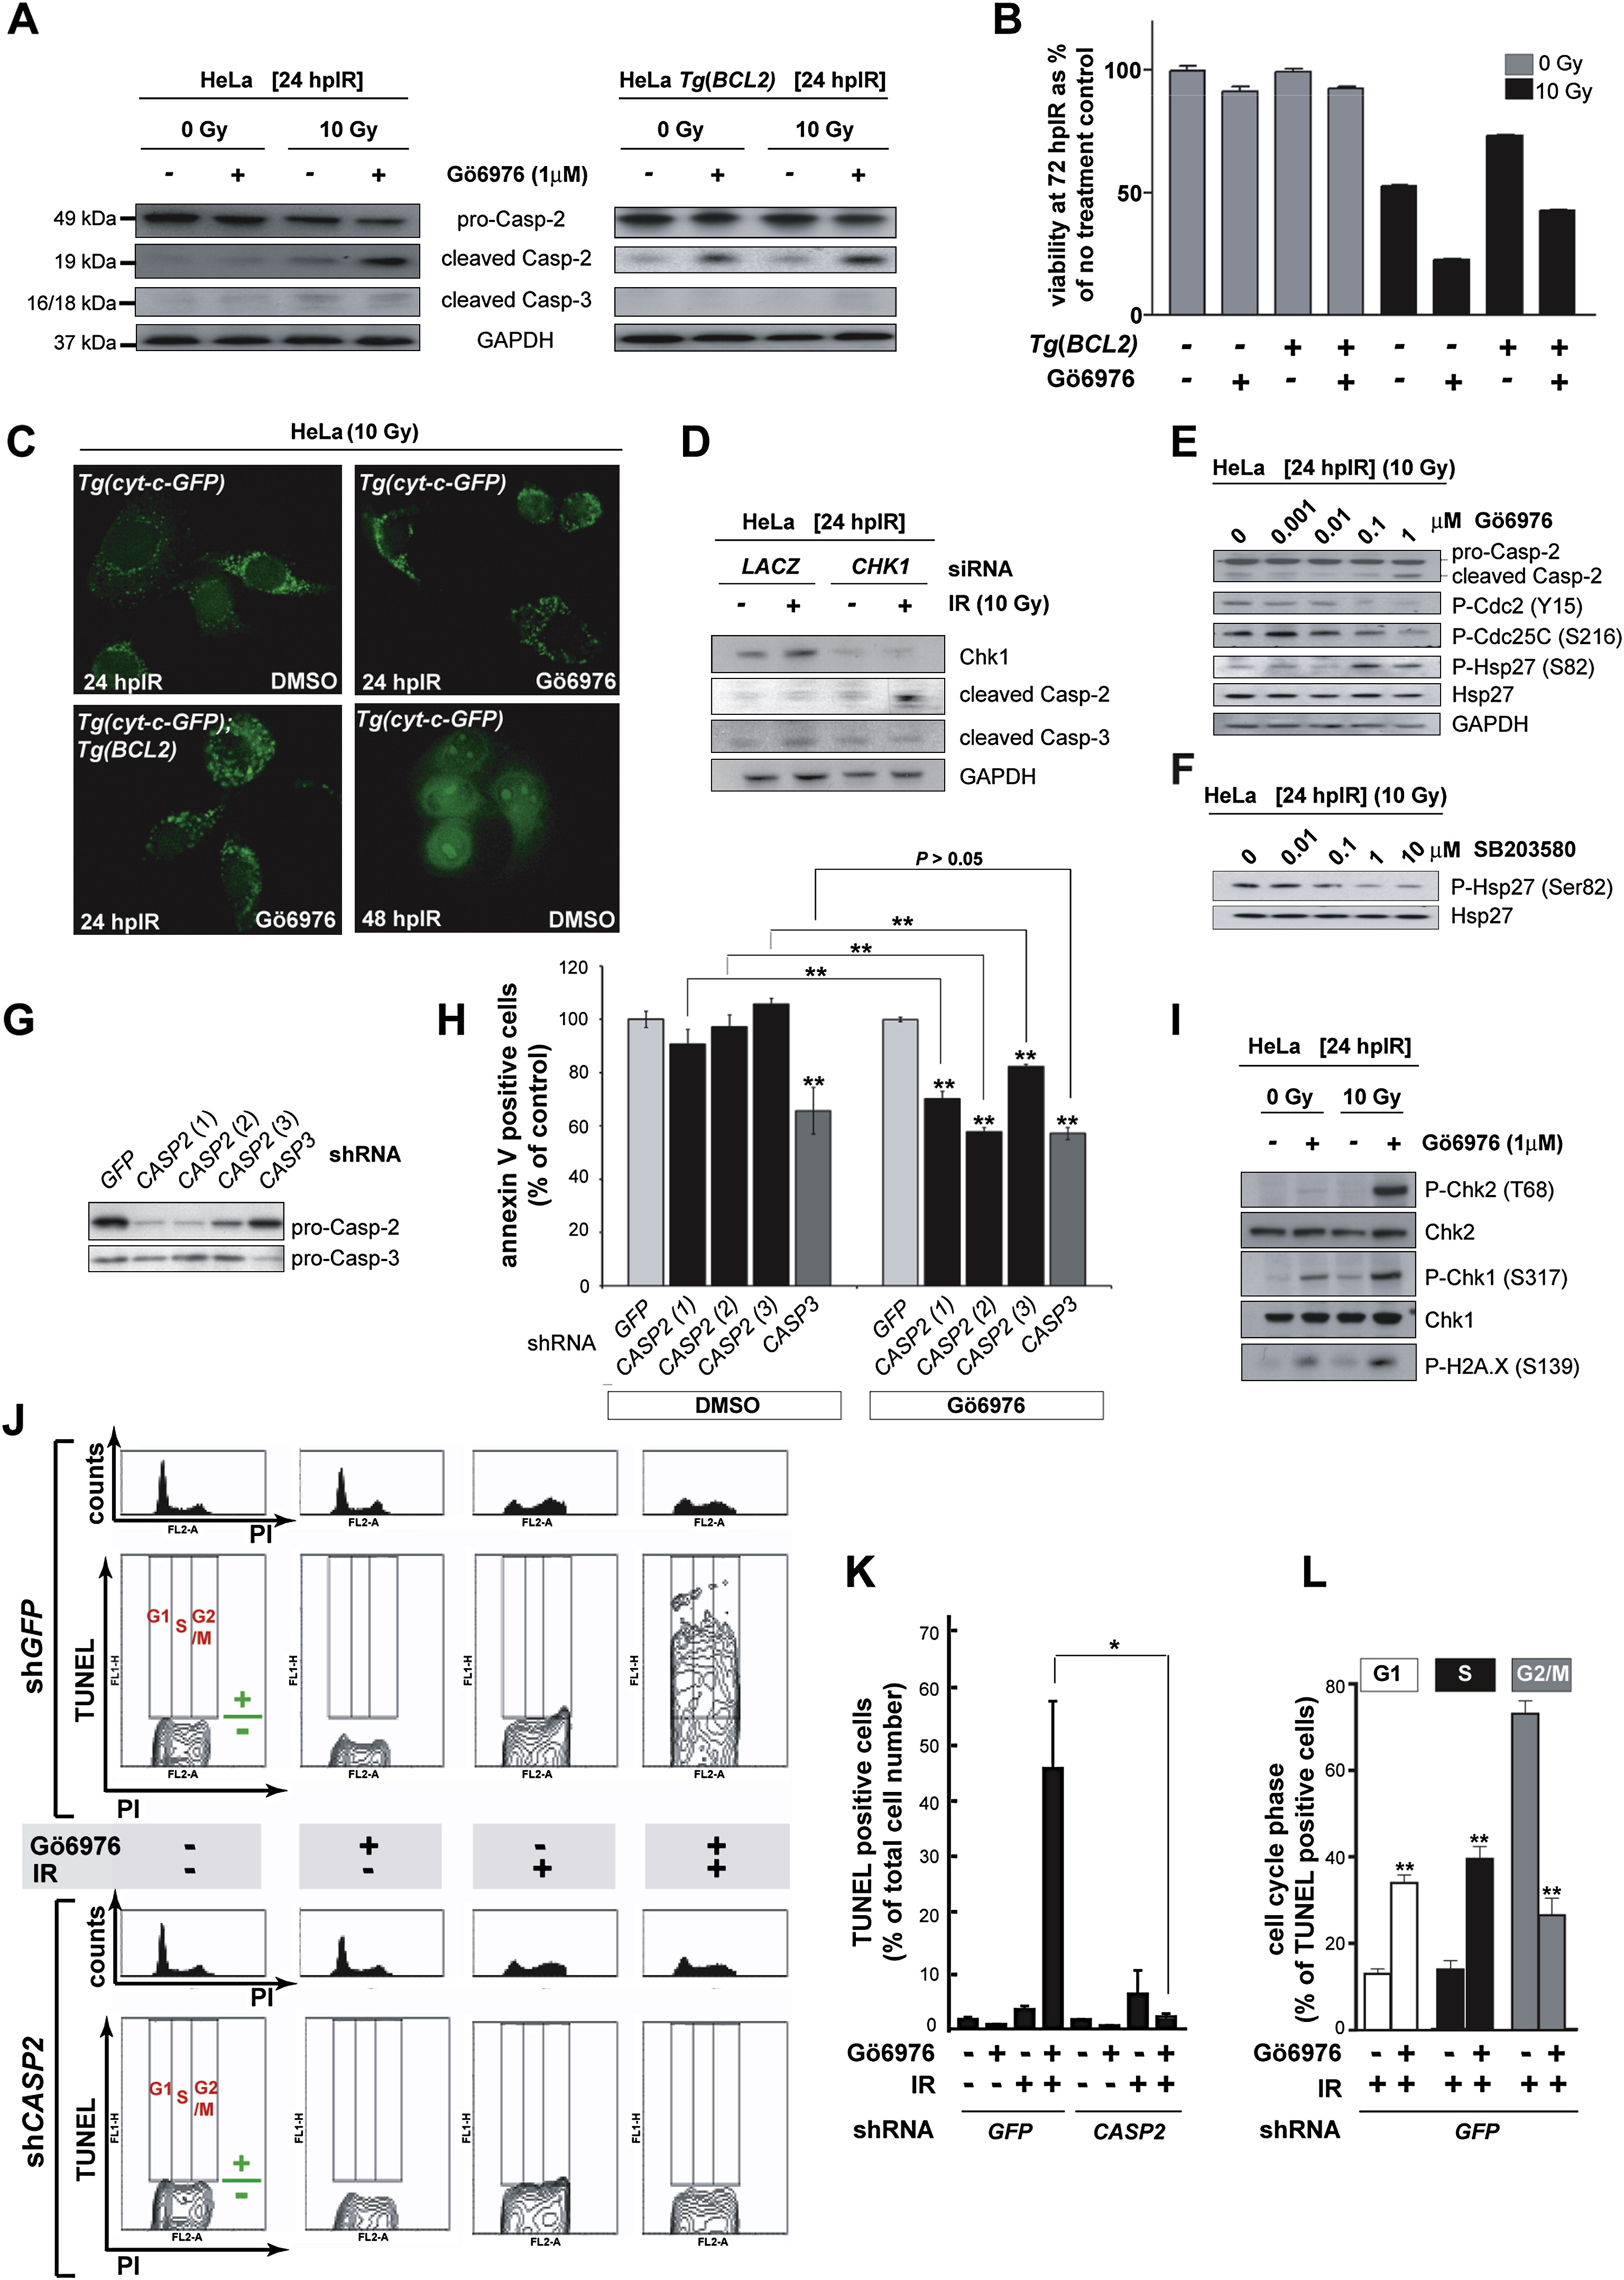
Fig. 5 The Chk1-Suppressed Pathway Is Conserved in HeLa Cells
(A) Western blots comparing the levels of caspase-2 (pro and cleaved forms) and cleaved caspase-3 at 24 hpIR in lysates from HeLa cells carrying or not carrying a BCL2 transgene (Tg[BCL2]) and treated with or without IR (10 Gy) or Chk1 inhibitor (Gö6976, 1 μM).
(B) Analysis of HeLa cell survival at 72 hpIR (0 Gy versus 10 Gy) in the presence or absence of Gö6976 and/or BCL2. Gö6976 radiosensitizes the cells ∼2-fold regardless of the BCL2 transgene (compare bars 5 and 6, and bars 7 and 8). Note that BCL2 is functional (i.e., radioprotective) in these experiments (compare lanes 5 and 7). Data are means ± SEM.
(C) Fluorescent images of HeLa Tg(Cyt-c-GFP) cells with or without Tg(BCL2) or Gö6976 at 24 or 48 hpIR (10 Gy). Note the punctate GFP patterns in all 24 hpIR samples and the diffuse GFP pattern in the 48 hpIR sample.
(D) Levels of cleaved caspase-2 and caspase-3 at 24 hpIR (10 Gy) in HeLa cells transfected with LACZ or CHK1 siRNAs at 72 hr before IR.
(E) Western blots comparing the activities of Chk1 (Cdc2 phosphorylation at Tyr15 and CDC25C phosphorylation at Ser216) and MK-2 (Hsp-27 phosphorylation at Ser82) following exposure to IR and increasing concentrations of Gö6976.
(F) MK-2 phosphorylates Hsp-27 in HeLa cells. Western blot of lysates from irradiated HeLa cells exposed to increasing concentrations of the p38MAPK specific inhibitor SB203580 (Reinhardt et al., 2007), showing a dose-dependent reduction in phosphorylated Hsp-27.
(G) Knockdown efficiencies of the indicated shRNAs as measured by western blots with anticaspase-2 and anticaspase-3 antibodies.
(H) Effects of GFP, CASP2, and CASP3 shRNAs on apoptotic cell numbers at 48 hpIR as measured by AnnexinV (+) / PI (-) staining of HeLa cells treated with 10 Gy with or without Gö6976 (1 μM). For each shRNA, the average apoptotic cell number (given as % of GFP shRNA control) is shown. All data are means ± SD ** p < 0.01 (two-tailed Student's t test). Asterisks on top of bars refer to comparisons with GFP shRNA.
(I) Synergistic activation of ATM and ATR by Gö6976 and IR. Western blots comparing the activities of ATM (Chk2 phosphorylation at Thr68) and ATR (Chk1 phosphorylation at Ser317) after 0 or 10 Gy IR with or without Gö6976 (1 μM). Levels of DNA damage were detected with an antiphospho-H2A.X antibody.
(J) Cell-cycle distribution of HeLa cells undergoing Chk1-suppressed apoptosis. HeLa cells harboring GFP or CASP2 shRNAs and treated with or without 10 Gy IR with or without Gö6976 (1 μM), as indicated, were fixed at 48 hpIR and stained for TUNEL and PI. For each shRNA line, upper panels show PI-single histograms and lower panels show PI/TUNEL double-staining images. Cell-cycle phases and threshold for TUNEL positivity are indicated in red and green, respectively, in each no-treatment control images.
(K) Quantification of the TUNEL stains shown in (J). Data are means ± SEM * p < 0.05 (two-tailed Student's t test).
(L) Quantified data from experiment in (J) expressed as means ± SEM ** p < 0.002 (two-tailed Student's t test). White bars indicate cells dying in G1 phase. Black bars indicate cells dying in S phase. Grey bars, cells dying in G2 phase.
Reprinted from Cell, 133(5), Sidi, S., Sanda, T., Kennedy, R.D., Hagen, A.T., Jette, C.A., Hoffmans, R., Pascual, J., Imamura, S., Kishi, S., Amatruda, J.F., Kanki, J.P., Green, D.R., D'Andrea, A.A., and Look, A.T., Chk1 Suppresses a Caspase-2 Apoptotic Response to DNA Damage that Bypasses p53, Bcl-2, and Caspase-3, 864-877, Copyright (2008) with permission from Elsevier. Full text @ Cell