
|
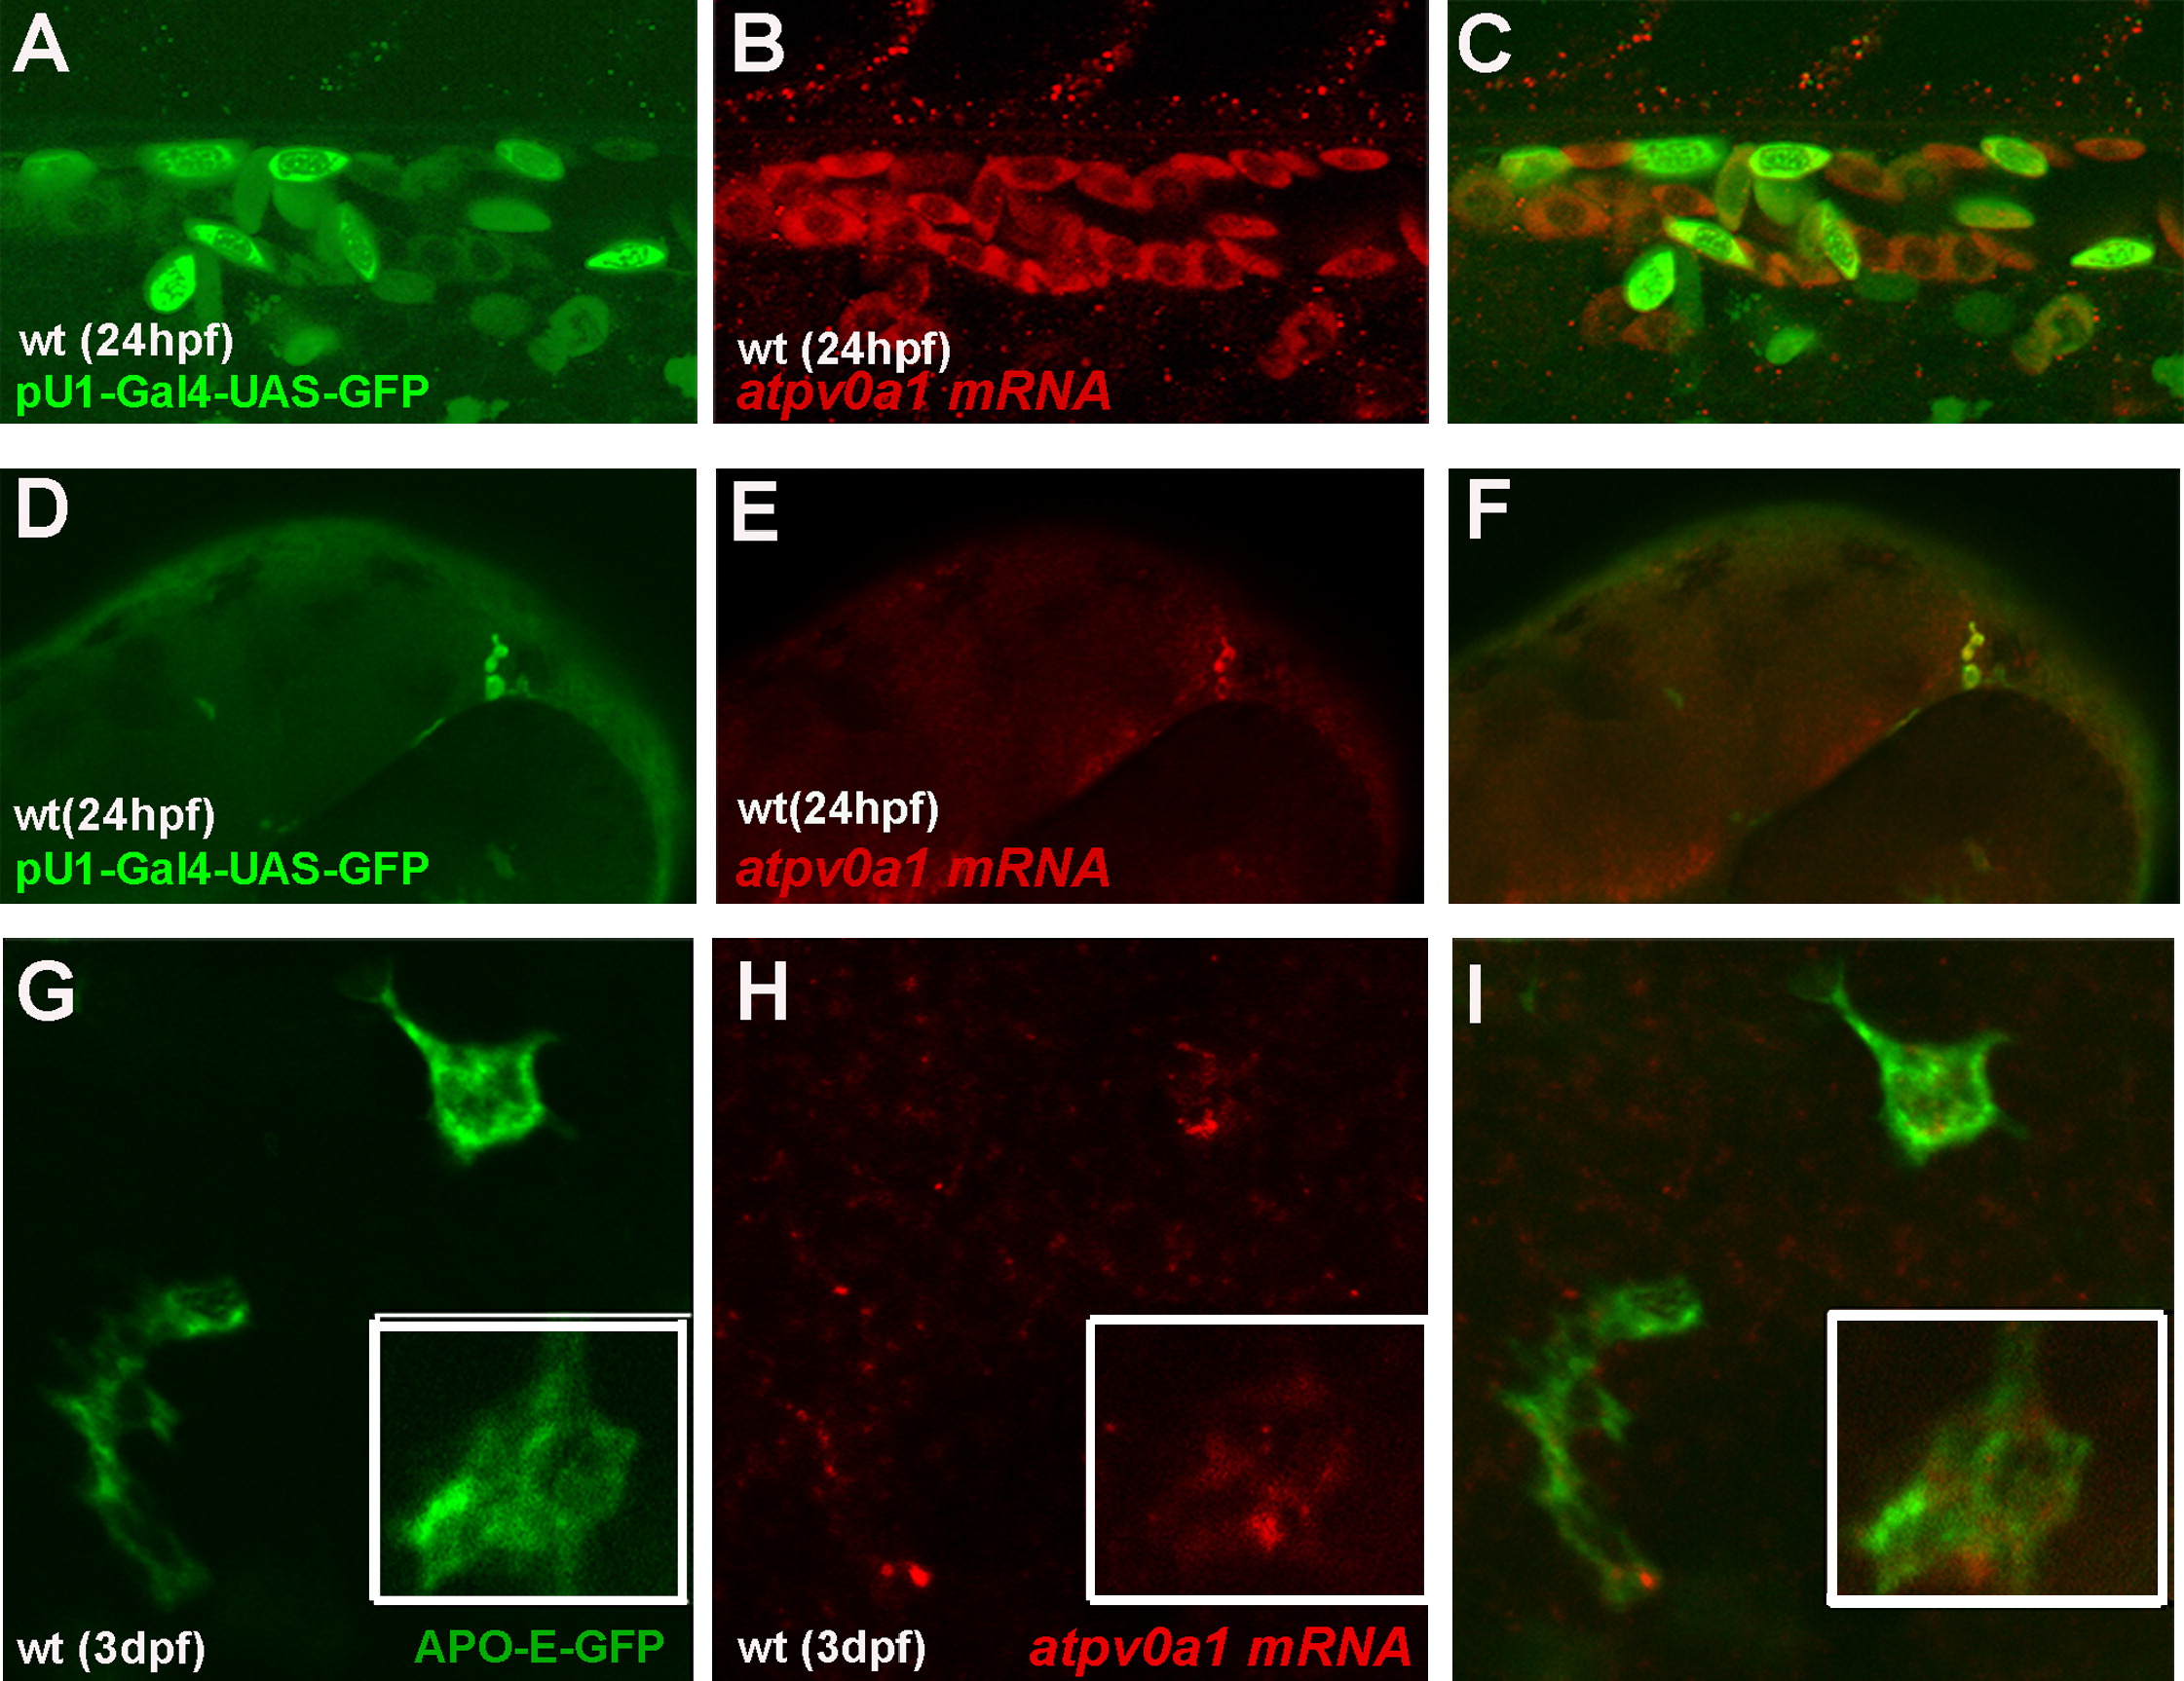
Fig. 3 v0-ATPase a1 Expression in Macrophages and Microglia of the Zebrafish Embryo
(A–C) Side view of the wild-type fish trunk at 1 dpf (day post fertilization). (A) pU1-Gal4-UAS-GFP labels the myeloid lineage in green. (B) atp6v0a1 expression in red (C) Merge.
(D–F) Side view of the wild-type fish head at 1 dpf (days post fertilization). (D) pU1-Gal4-UAS-GFP labels the myeloid lineage in green. (E) atp6v0a1 expression is in red. (F) Merge.
(G–I) Dorsal view of the wild-type fish head at 3 dpf (days post fertilization). (G) Apo-E-GFP labels microglial cells in green. (H) atp6v0a1 expression in red (I) Merge. In the bottom right corner is an enlargement of an APO-E-positive cell expressing atp6v0a1 mRNA.
Reprinted from Cell, 133(5), Peri, F., and Nüsslein-Volhard, C., Live Imaging of Neuronal Degradation by Microglia Reveals a Role for v0-ATPase a1 in Phagosomal Fusion In Vivo, 916-927, Copyright (2008) with permission from Elsevier. Full text @ Cell