
|
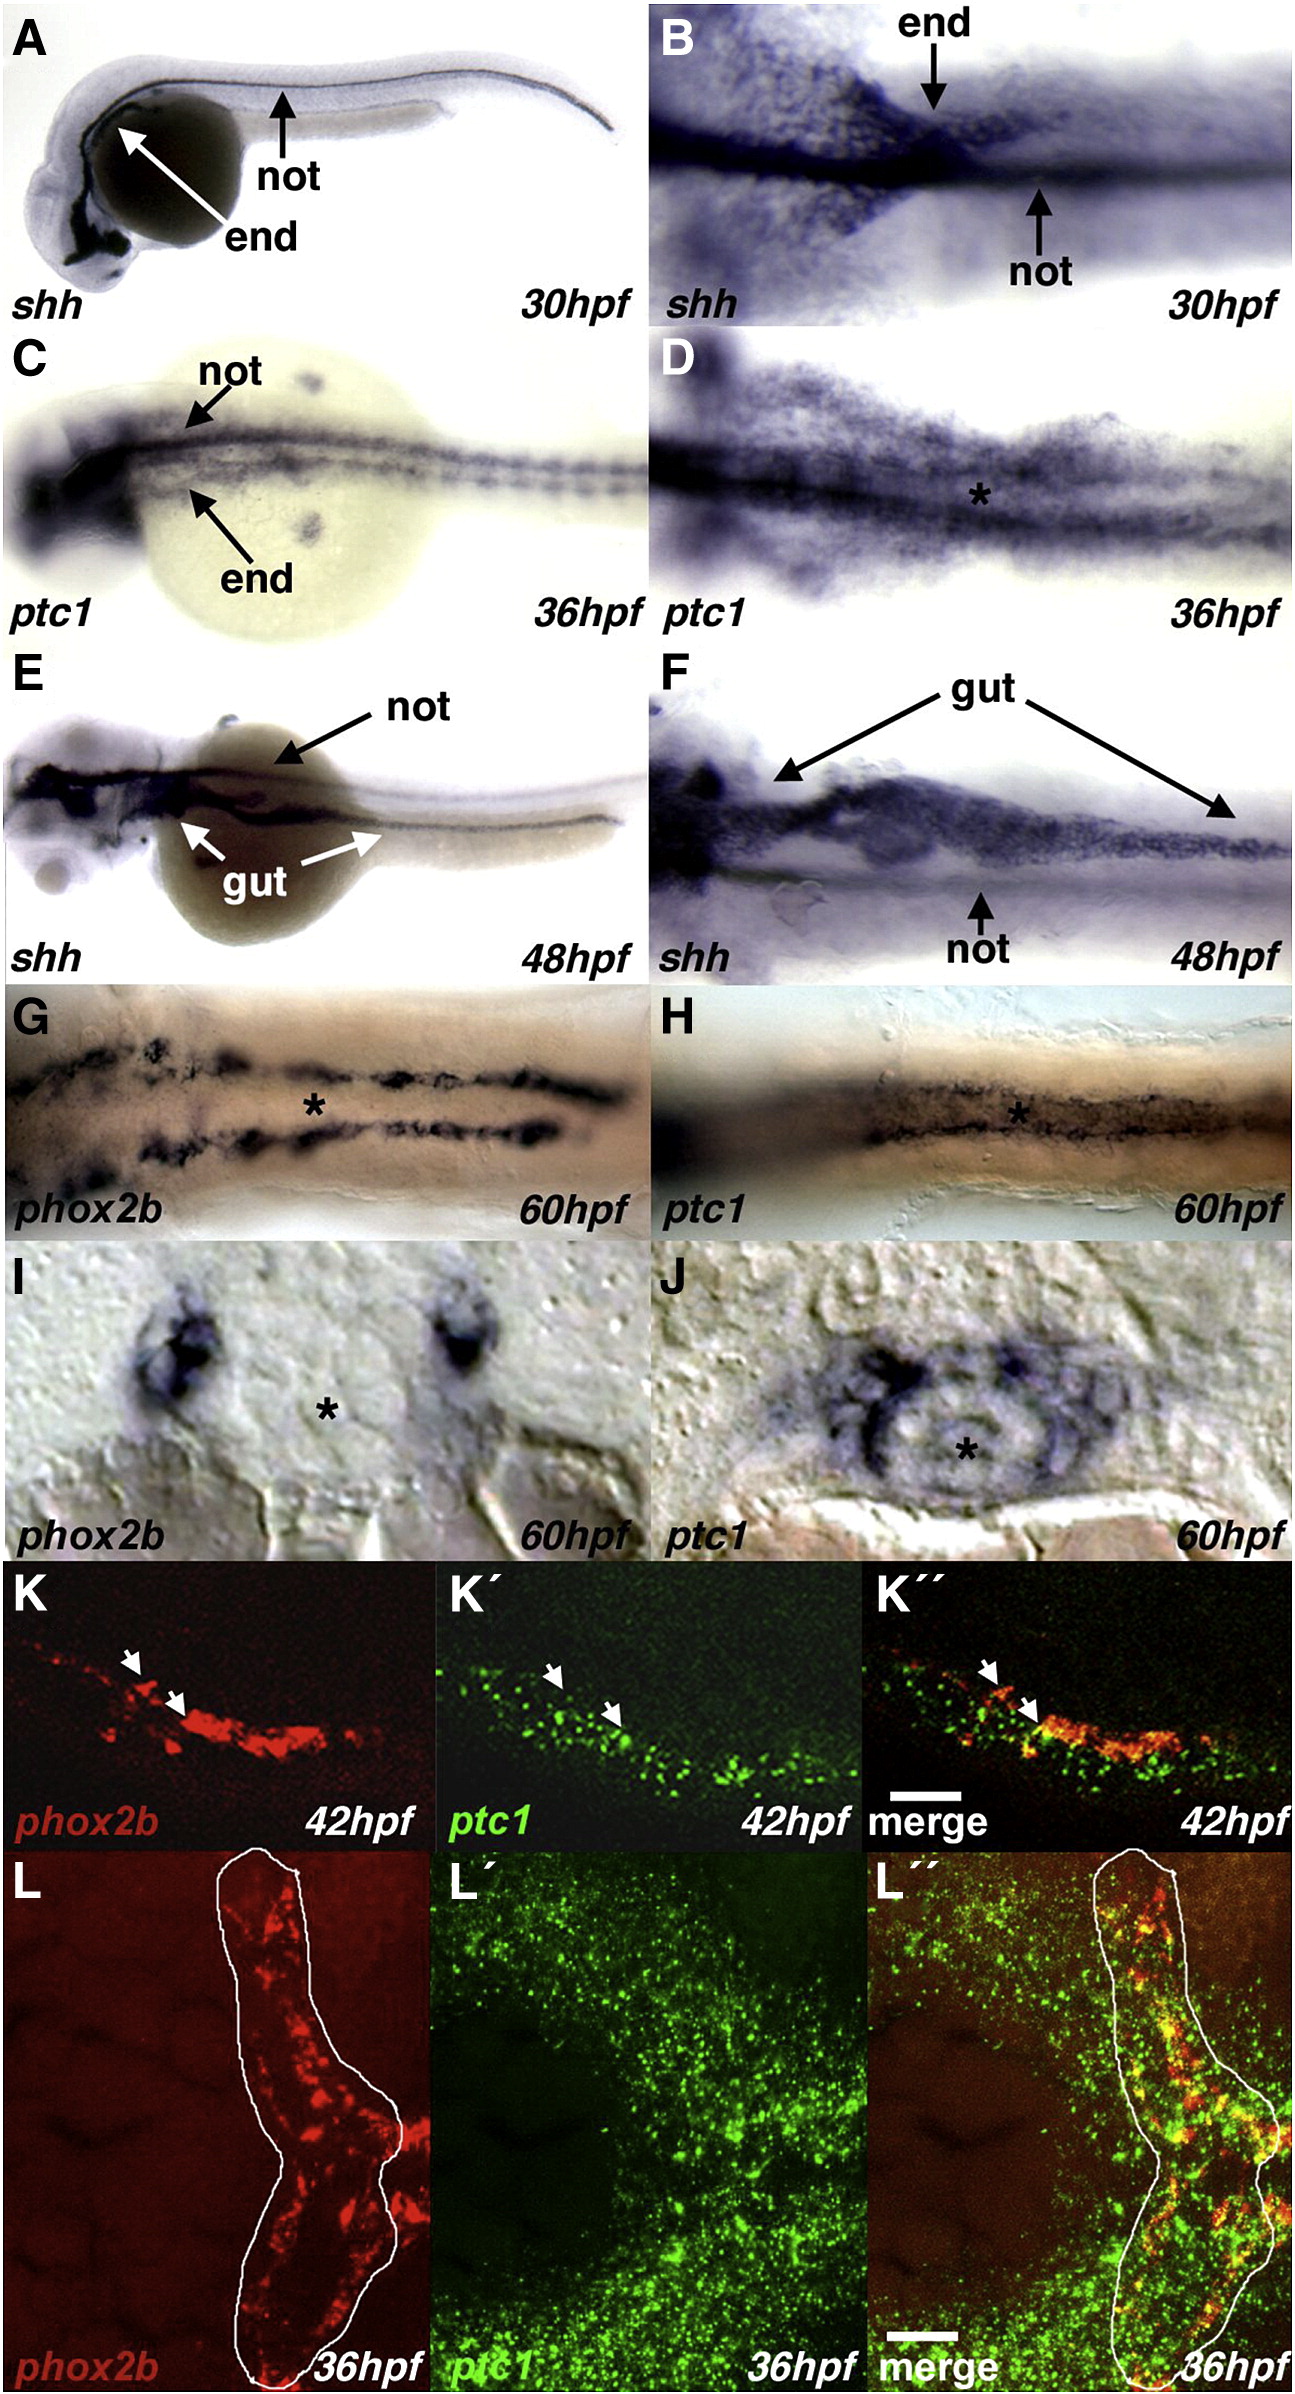
Fig. 3 The expression pattern of shh and ptc-1 correlate with the development of ENS. (A, B, E, F) Wholemount embryos hybridized in situ with a shh antisense probe at the indicated developmental stages. (C, D, H) Wholemount embryos hybridized in situ with a ptc-1 antisense probe at the indicated developmental stages. (G) 60 hpf wholemount in situ hybridized embryos hybridized with a phox2b antisense probe to reveal the distribution of the ENS NCC in the intestine. (I) Cross-section taken through a 60 hpf embryo hybridized with a phox2b antisense probe to reveal the distribution of ENS NCC in the intestine. (J) Cross-section taken through a 60 hpf embryo hybridized with a ptc-1 antisense probe. At all stages examined, shh and ptc-1 are expressed in regions that correlate with the development of the ENS. Furthermore, comparison of the pattern of ptc-1 expression in the intestine at 60 hpf shows that phox2b expressing ENS NCC are located in the ptc-1 expression domain. (K–K″) Comparison of the pattern of ptc-1 expression (K′, green channel) to that of phox2b (K, red channel) in the intestine at 42 hpf by double fluorescent in situ hybridization shows that phox2b expressing ENS NCC co-express ptc-1 (K″, merge channels). Expression was documented by confocal stacks of images (L–L″). Ventral view of the vagal region of a 36 hpf wildtype embryo showing a comparison of the pattern of ptc-1 expression (L′, green channel) to that of phox2b (K, red channel) by double fluorescent in situ hybridization showing pre-enteric ENS NCC's express ptc-1 (K″, merge channels). (A) Lateral view of embryo. (B, D, F, G, H, K–K″, L–L″) Ventral views of embryos with the yolk removed. (C, E) Dorsal views of embryo. not (A, B, C, E, F) indicates notochord. end (A–C) indicate endoderm. * (D, G, H, I, J) indicates the gut lumen. Arrows (K–K″) indicate ptc-1 phox2b coexpressing cells. The cells delineated by the white line in (L, L″) are the migrating pre-enteric ENS NCC. Scale bar (K″, L″) is 20 μm. In all wholemounts (A–H) anterior is to the left.
Reprinted from Developmental Biology, 318(1), Reichenbach, B., Delalande, J.M., Kolmogorova, E., Prier, A., Nguyen, T., Smith, C.M., Holzschuh, J., and Shepherd, I.T., Endoderm-derived Sonic hedgehog and mesoderm Hand2 expression are required for enteric nervous system development in zebrafish, 52-64, Copyright (2008) with permission from Elsevier. Full text @ Dev. Biol.