
Image
|
Figure Caption
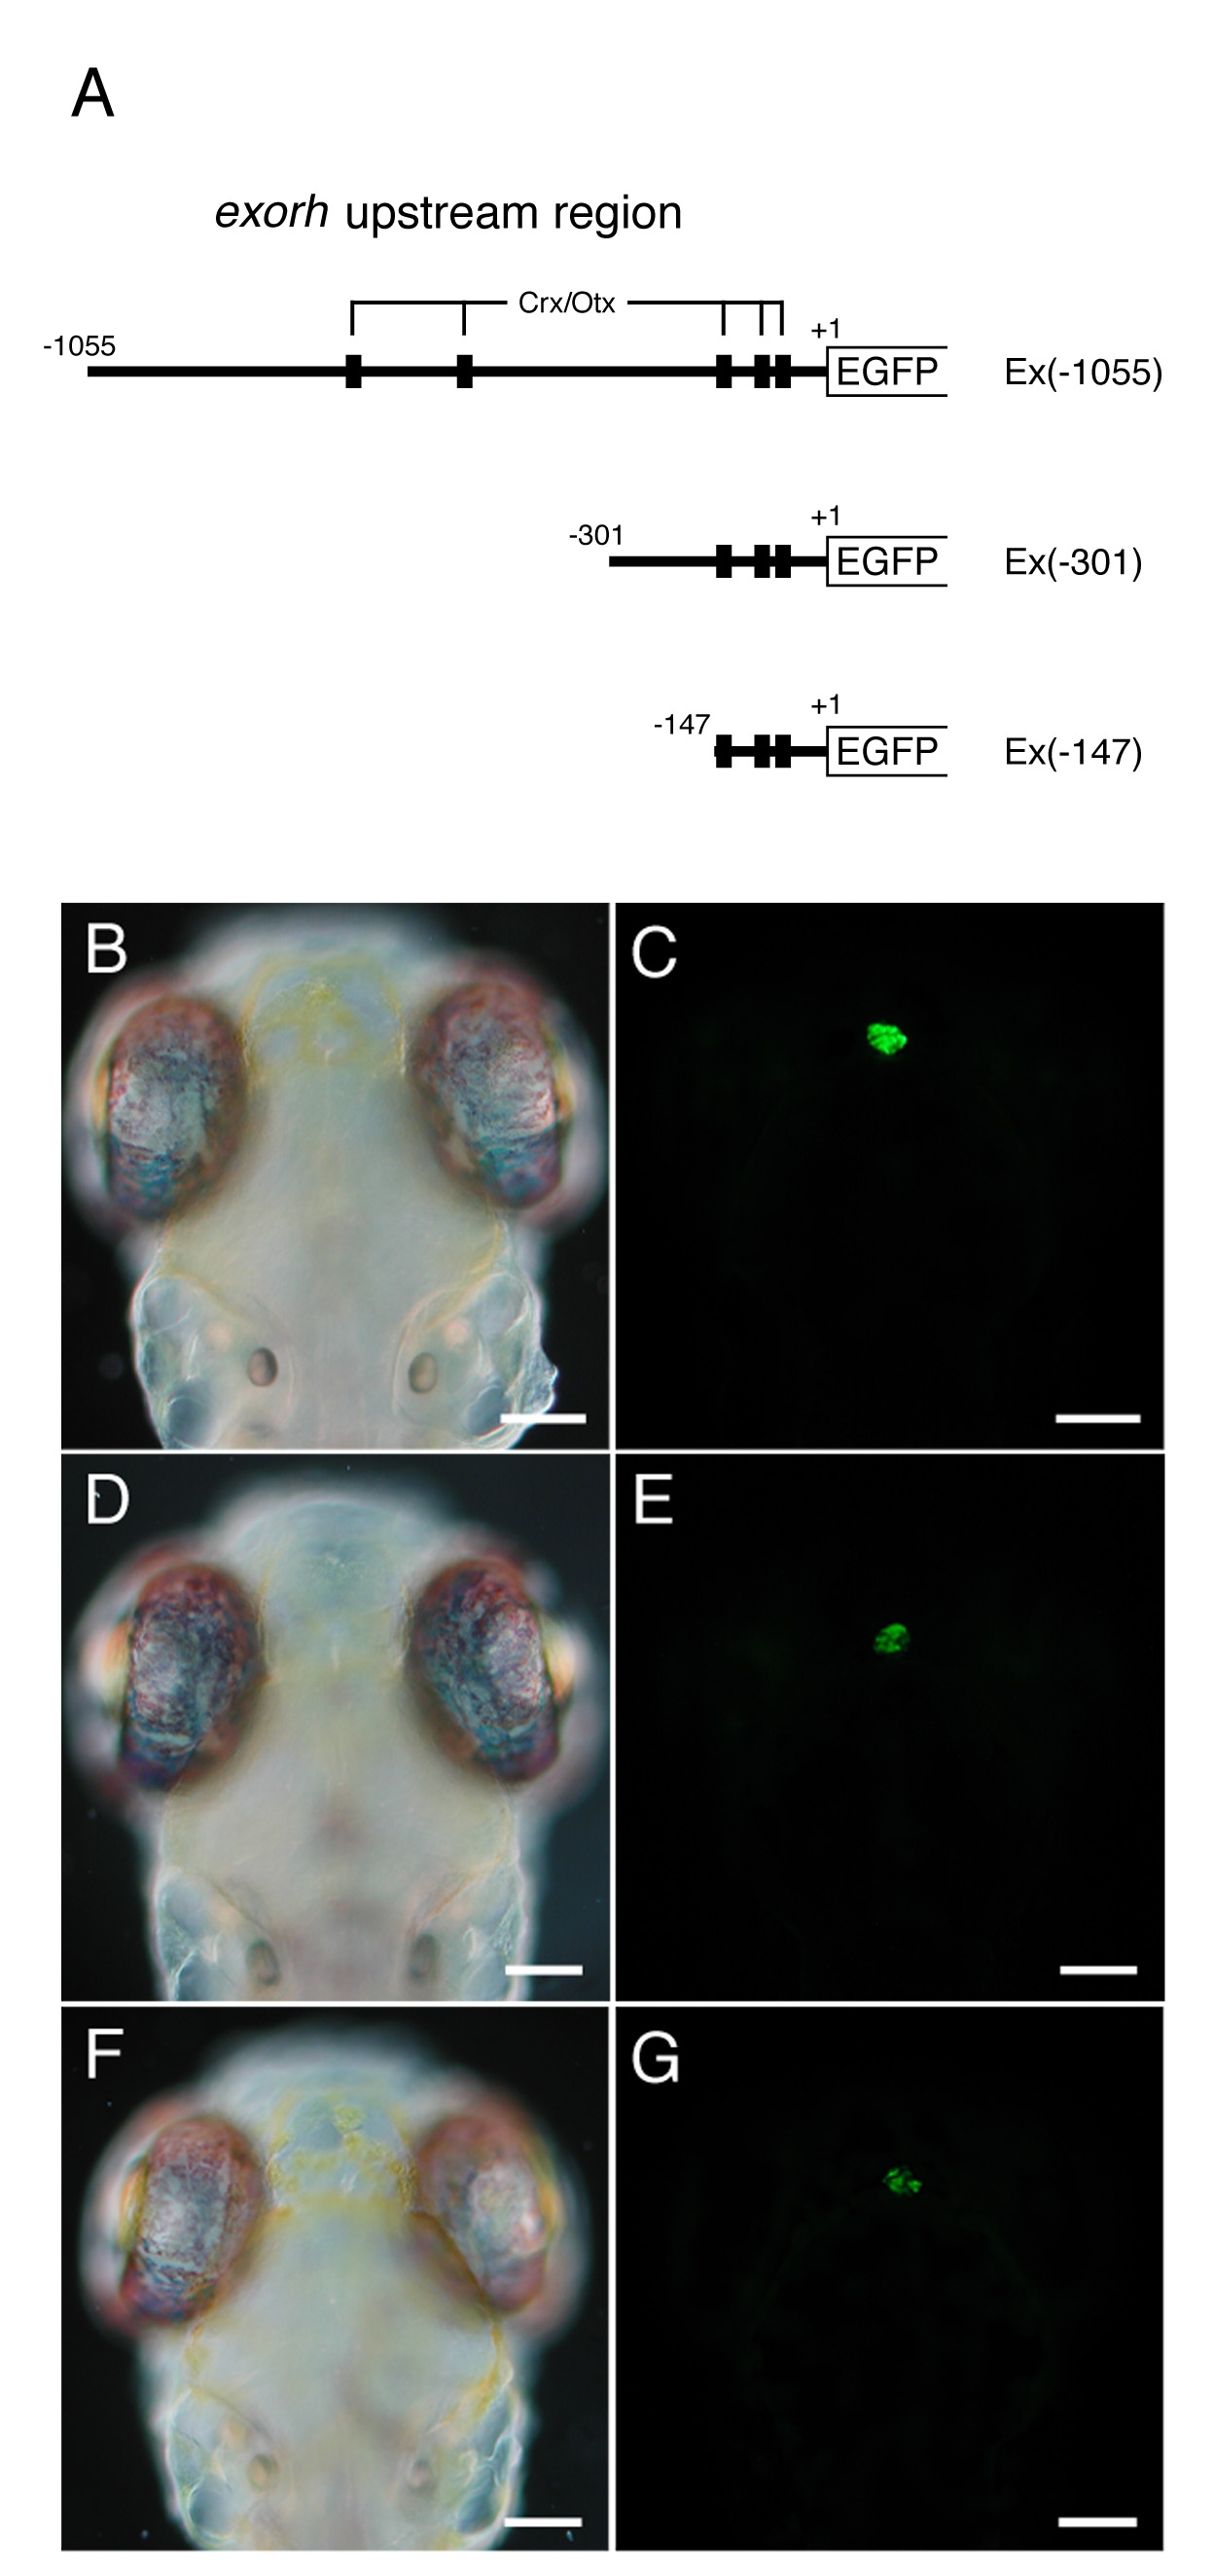
Fig. 6 5′-Deletion analysis of the exorh promoter. (A) Schematic representation of the constructs, Ex(–1055), Ex(–301), and Ex(–147). (B–G) Dorsal views (anterior up) of Nomarski (B, D, and F) and EGFP fluorescent (C, E, and G) images of Ex(–1055) (B and C), Ex(–301) (D and E), and Ex(–147) (F and G) transgenic larvae at 7 dpf. The larvae in C, E, and G were photographed under the same exposure conditions. The larvae were treated with 0.003% 1-phenyl-2-thiourea. (Bars = 100 μm.)
Acknowledgments
This image is the copyrighted work of the attributed author or publisher, and
ZFIN has permission only to display this image to its users.
Additional permissions should be obtained from the applicable author or publisher of the image.
Full text @ Proc. Natl. Acad. Sci. USA