
|
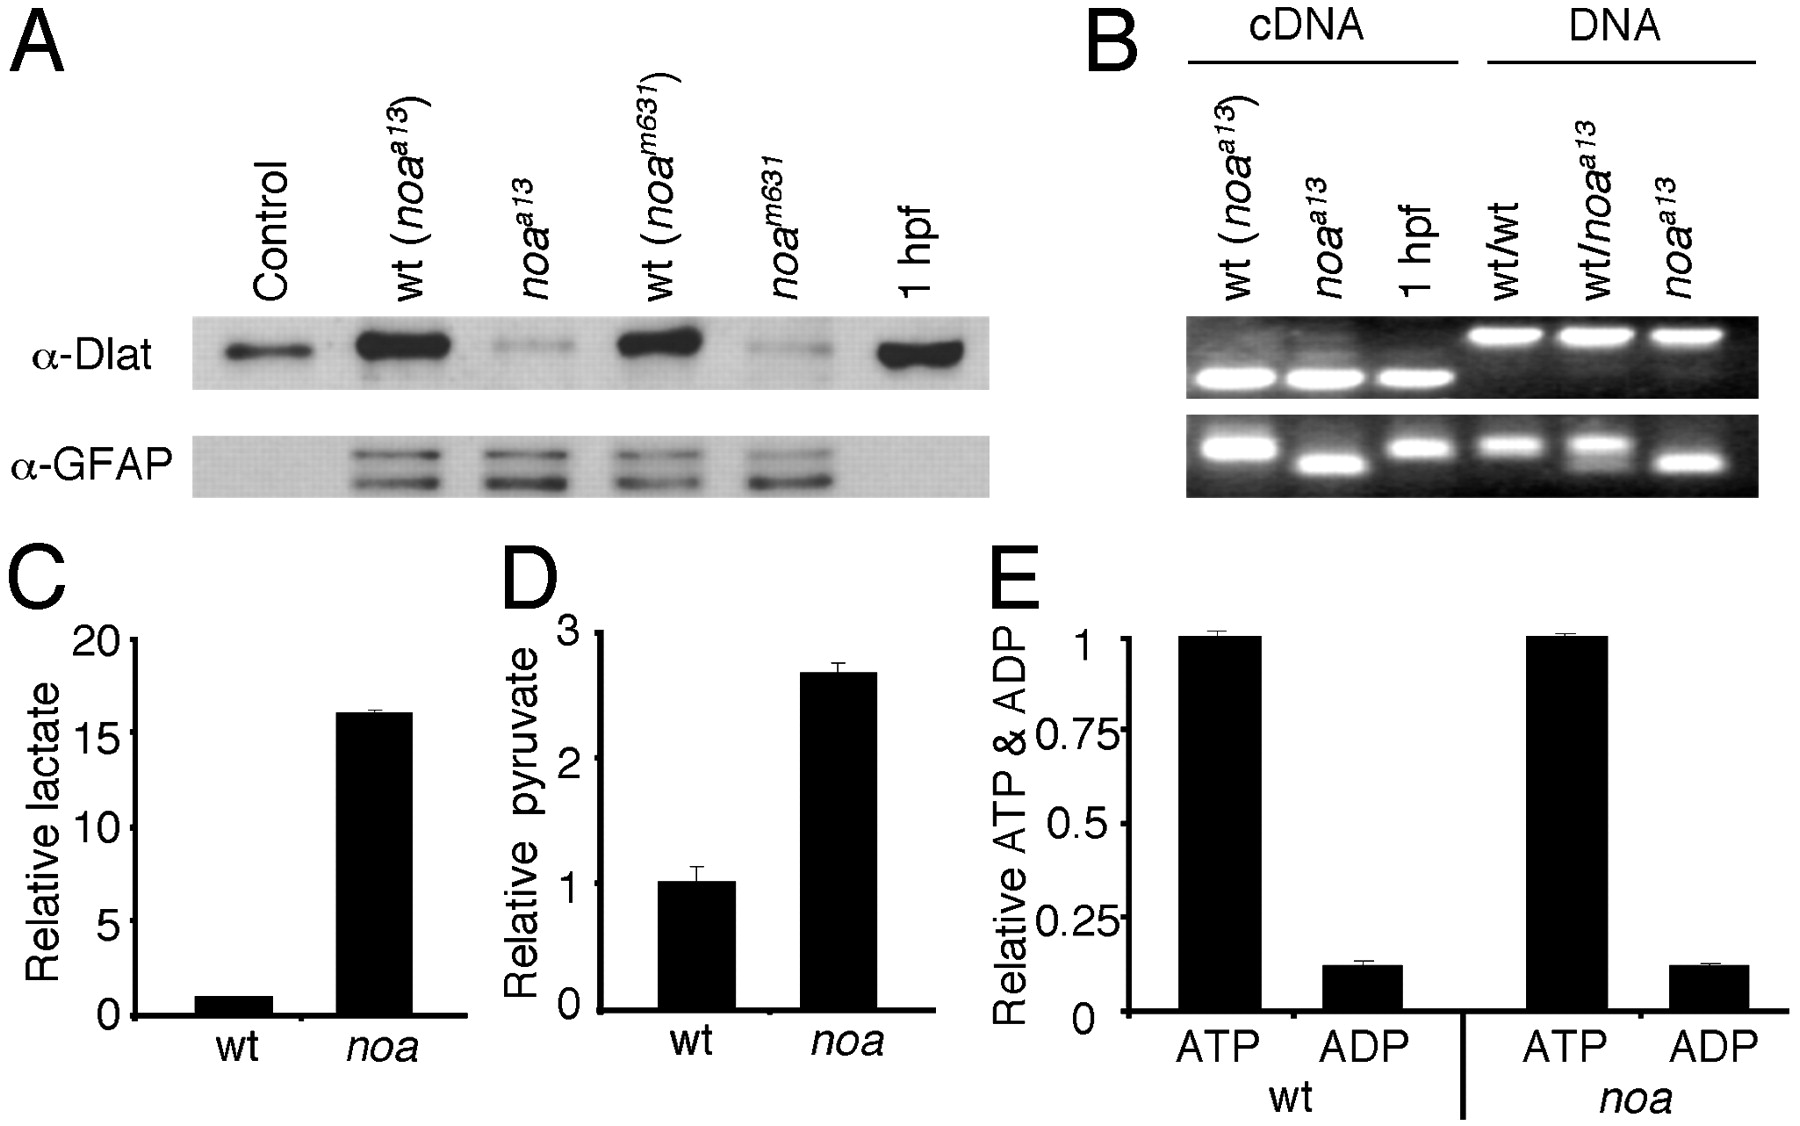
Fig. 3 Biochemical characterization of noa. (A) Immunoblots of porcine heart PDH (control), wild-type noaa13 siblings [wt (noaa13)], noaa13 mutants (noaa13), wild-type noam631 siblings [wt (noam631)], noam631mutants (noam631), and embryos at 1 hpf using anti-Dlat (Upper) or anti- glial fibrillary acidic protein as a loading control (Lower). (B Upper) RT-PCR (cDNA) and genomic DNA (DNA) PCR using primers that flank a small intron showing mRNA is maternal. (B Lower) PCR using primers that flank the C to T transition in the a13 allele followed by restriction digestion with NlaIII. Quantification of lactate (wt, 165 ± 12 pmol per larvae; noa, 2,655 ± 2 pmol per larvae) (C); pyruvate (wt, 101 ± 7 pmol per larvae; noa, 267 ± 13 pmol per larvae) (D); and ATP and ADP (ATP: wt, 65 ± 1 pmol per larvae; noa, 65 ± 1 pmol per larvae; and ADP: wt, 5.8 ± 0.6 pmol per larvae; noa, 5.9 ± 0.3 pmol per larvae) (E)at 6 dpf are shown. Graphs indicate relative values, and the error bars are the SEM.