
|
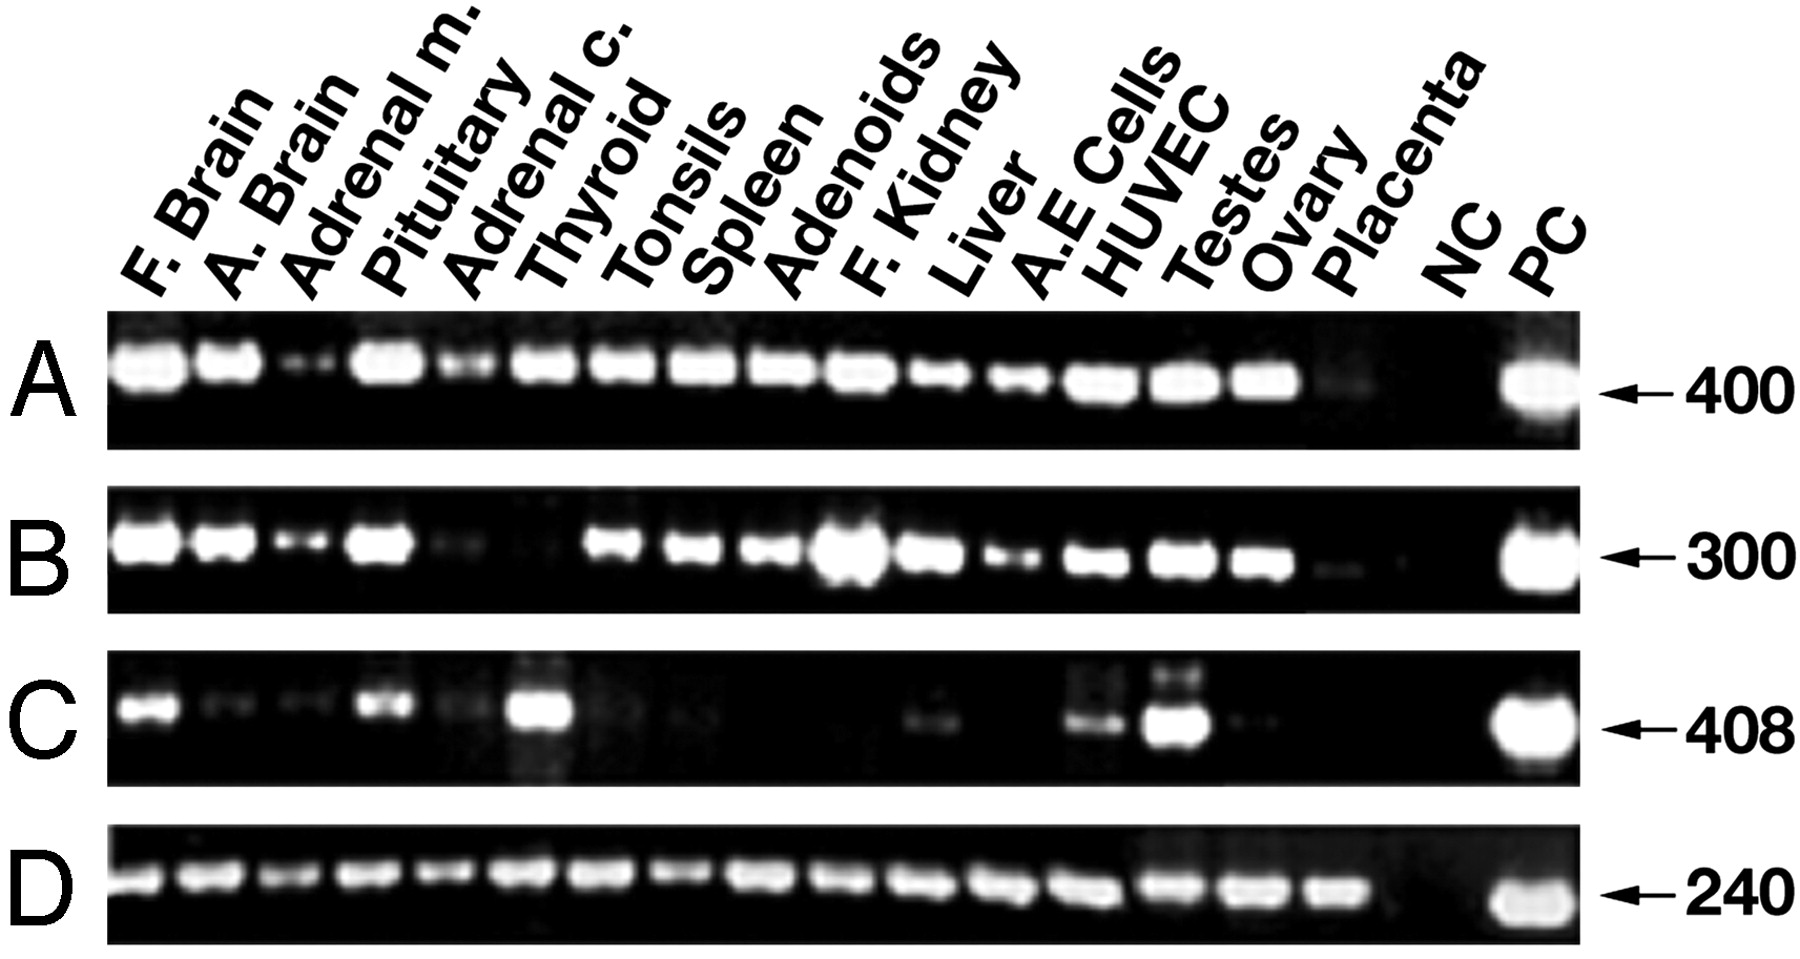
Fig. 2 Expression pattern of hSef isoforms. Expression was determined by RT-PCR by using total RNA from the indicated human tissues and human primary cells. Amplification was performed with primers derived from hSef common region (A) and with specific primers for hSef-a (B) or hSef-b (C). Amplification of GAPDH transcript (D) compares RNA levels in each sample. Adrenal m. and adrenal c. denote adrenal medulla and cortex, respectively. A.E. cells, primary aortic endothelial cells. HUVEC, human umbilical vein endothelial cells; F, fetal; A, adult; NC, negative control. Templates for positive controls (PC) are plasmids containing hSef-a (A and B), hSef-b (C), or GAPDH (D).