
Image
|
Figure Caption
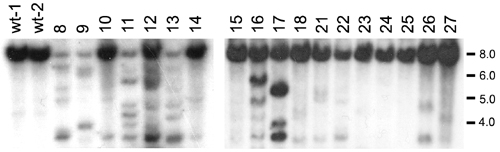
Fig. 6 Myc-induced leukemias have oligoclonal TCR-α gene rearrangement. Southern blot analysis of genomic DNA digested with BglII and hybridized with the TCR-α constant region probe is shown. Representative DNAs of Myc-induced leukemias are shown (numbered) and compared with DNA from the thymus of rag2-GFP control fish (wt-1 and wt-2). The nonrearranged BglII restriction fragment is 8.0 kb; sizes of DNA standards in kilobases are noted to the right of blots.
Acknowledgments
This image is the copyrighted work of the attributed author or publisher, and
ZFIN has permission only to display this image to its users.
Additional permissions should be obtained from the applicable author or publisher of the image.
Full text @ Proc. Natl. Acad. Sci. USA