
|
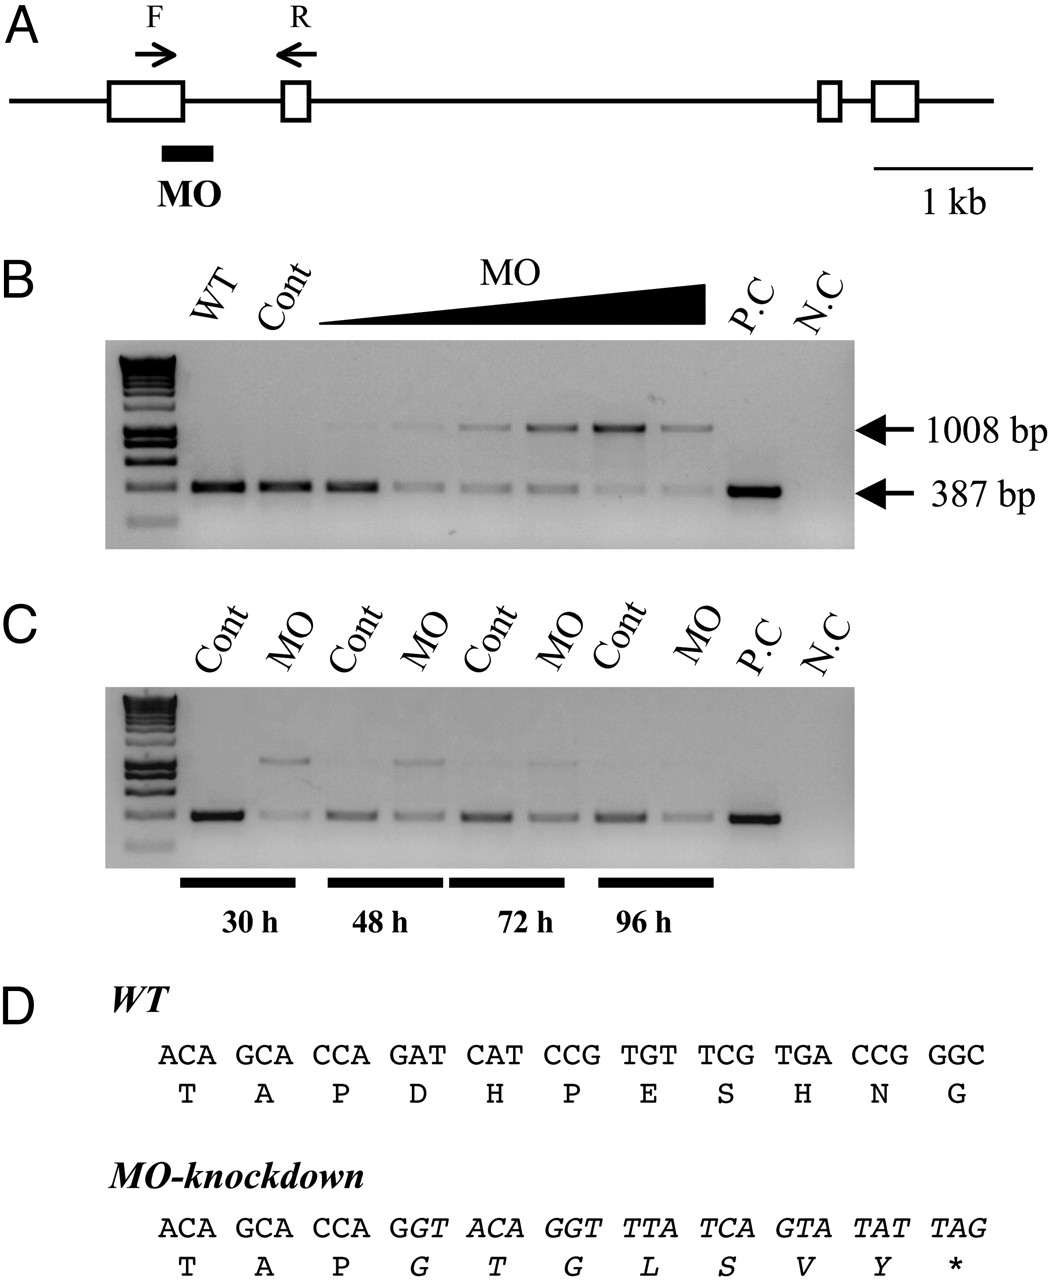
Fig. 3 Knockdown of functional IGFBP-1 with splice-site-targeting MOs. (A) Structure of the zebrafish IGFBP-1 gene. Exons are shown as boxes, and introns are shown as lines. The splice donor site targeted by the IGFBP-1 MO is underlined. The primer set used for RT-PCR is shown as arrows. F, forward primer; R, reverse primer. (Scale bar, 1 kb.) (B) Dose-dependent effect after 0.5, 1, 2, 4, 8, or 16 ng MO1 was injected into embryos. The specific primer set amplified a 387-bp spliced form of IGFBP-1, whereas MO knockdown caused an aberrant splice form (1,008 bp). WT, wild-type; Cont, control MO; P.C., positive control of PCR; N.C., negative control of PCR. (C) Time-course effect. MO1 at dose of 2 ng was injected into embryos, and the knockdown effect was analyzed by RT-PCR at 30, 48, 72, and 96 h after the injection. (D) Sequence analysis of the IGFBP-1 cDNAs isolated from the wild-type and MO1-injected embryos. The sequence of the aberrantly spliced form is italicized. Note that the aberrant splicing form results in a coding-frame shift and a premature stop codon.