
|
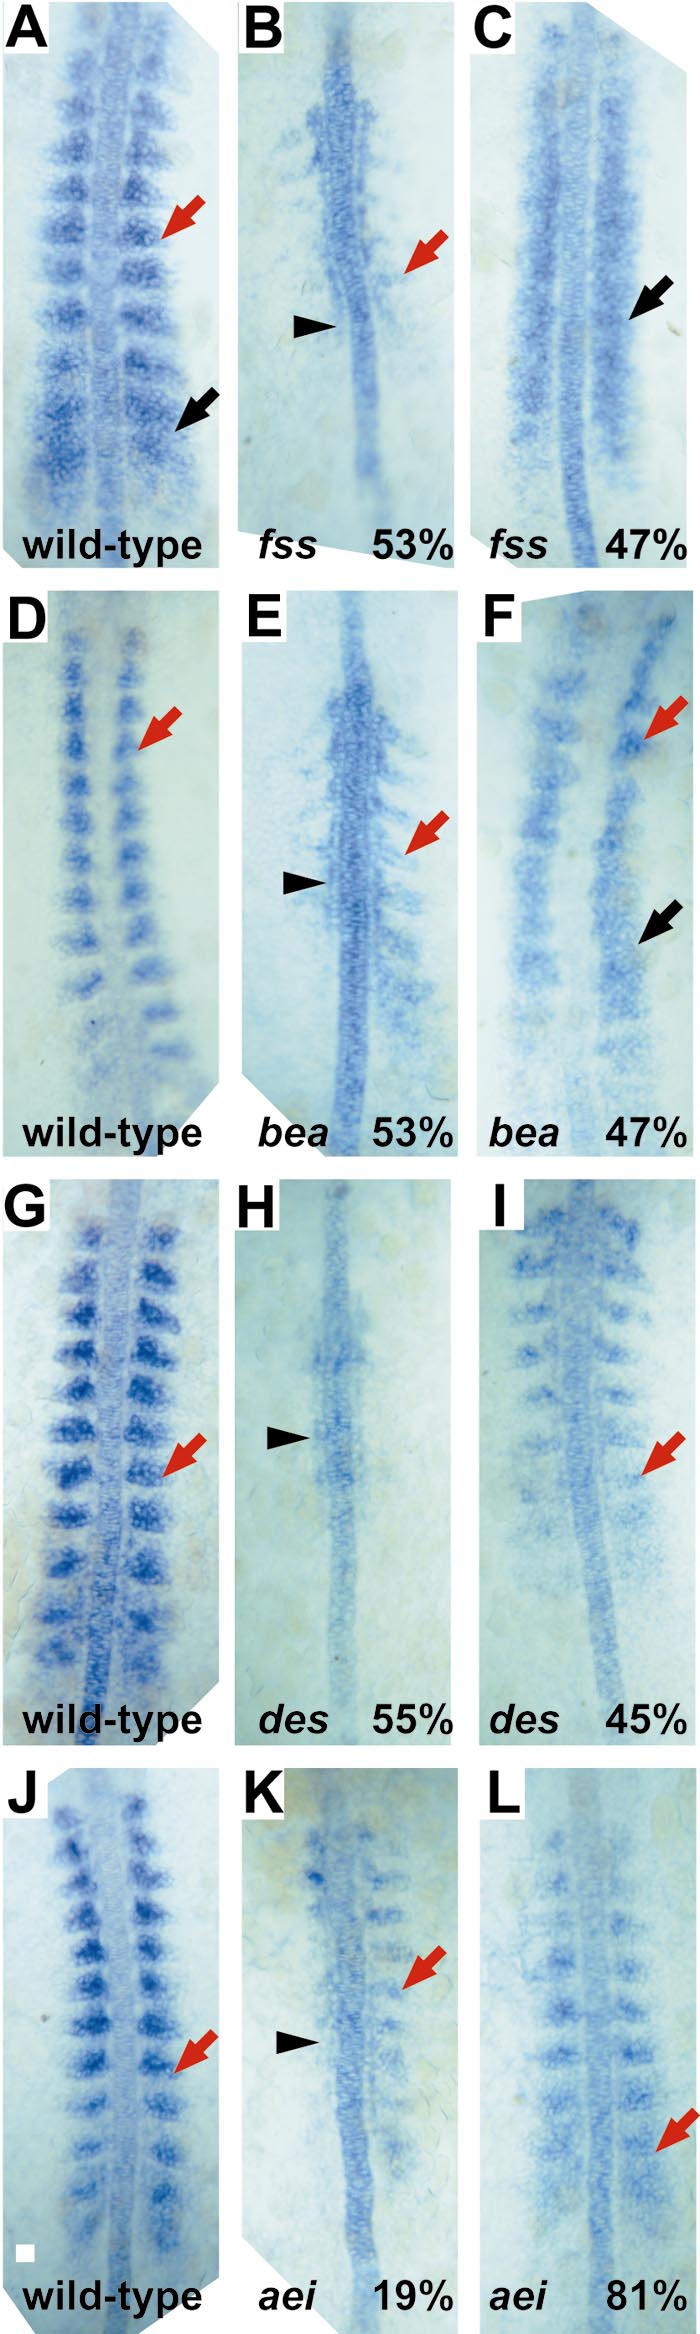
Fig. 9 fak mRNA expression is disrupted in the fss-type mutants. The percentages denote the percentage of mutant embryos that showed a particular type of fak expression. Red arrows denote the last formed somite, black arrowheads denote ectopic fak expression in adaxial cells, and black arrows designate nonsegmental fak expression. (A, D, G, J) Wild-type embryos at the 10-, 11-, 9-, and 10-somite stages, respectively. All mutant embryos were cultured with their wild-type siblings. (B, C) fused somite (fss) embryos, which do not form somites. (E, F) beamter (bea) embryos which form one to four somites. (H, I) deadly seven (des) embryos which form 5- to 9-somites. (K, L) after eight/DeltaD (ei/DeltaD) embryos which form 5- to 9-somites. Scale bar in (J), 20 μm.
Reprinted from Developmental Biology, 240(2), Henry, C.A., Crawford, B.D., Yan, Y.-L., Postlethwait, J., Cooper, M.S., and Hille, M.B., Roles for zebrafish focal adhesion kinase in notochord and somite morphogenesis, 474-487, Copyright (2001) with permission from Elsevier. Full text @ Dev. Biol.