
|
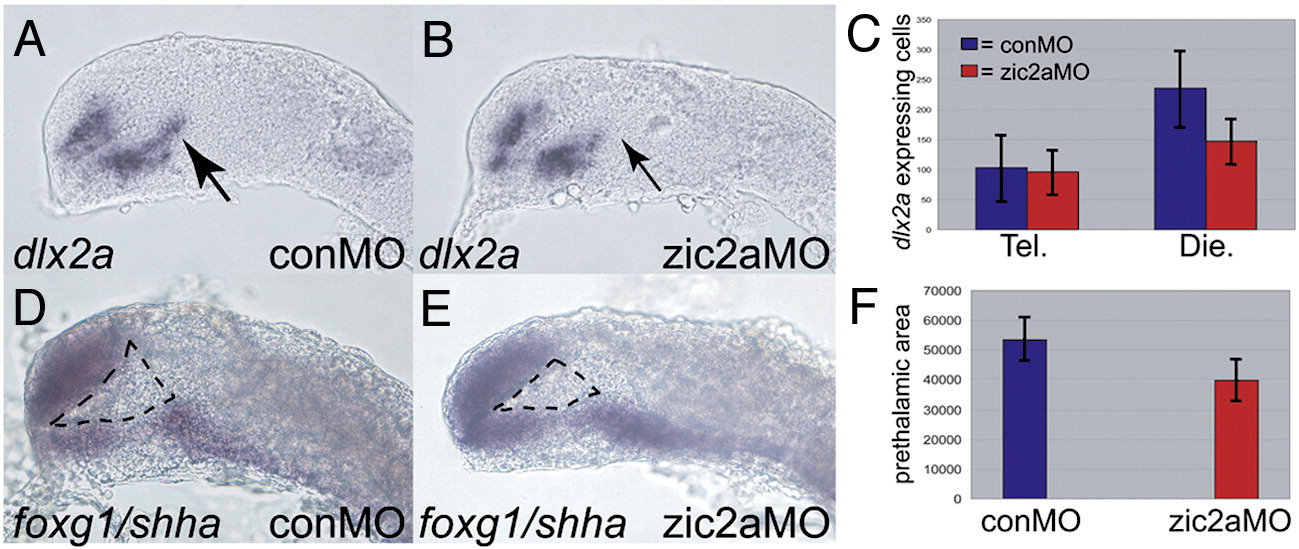
Fig. S4 PT defects in zic2a morphants at 17–18s. (A, B) dlx2a expression in the PT is reduced in Zic2a-depleted embryos (49/80 embryos, 3 exp.). (C) Graph showing average numbers of dlx2a-expressing cells in the telencephalon and diencephalon of conMO injected (n = 5) and zic2aMO injected (n = 9) embryos stained for dlx2a at 17–18s. Embryos were sectioned (see methods) to obtain accurate counts of dlx2a-expressing cells. There was no difference in number of telencephalic dlx2a-expressing cells between control and Zic2a morphants. However, there were significantly fewer diencephalic dlx2a-expressing cells in zic2aMOs compared to conMOs (p = 0.01). (D, E) foxg1 and shha expression was used to deliniate the prethalamic area at 17–18s. The dotted lines in D and E outline the prethalamic area. (F) Graph representing the average prethalamic area (pixels2) in conMOs (n = 10) and zic2aMOs (n = 8). Results are significant at p = 0.001. Embryos are shown in lateral views, anterior to the left.
Reprinted from Developmental Biology, 317(1), Sanek, N.A., and Grinblat, Y., A novel role for zebrafish zic2a during forebrain development, 325-335, Copyright (2008) with permission from Elsevier. Full text @ Dev. Biol.