
|
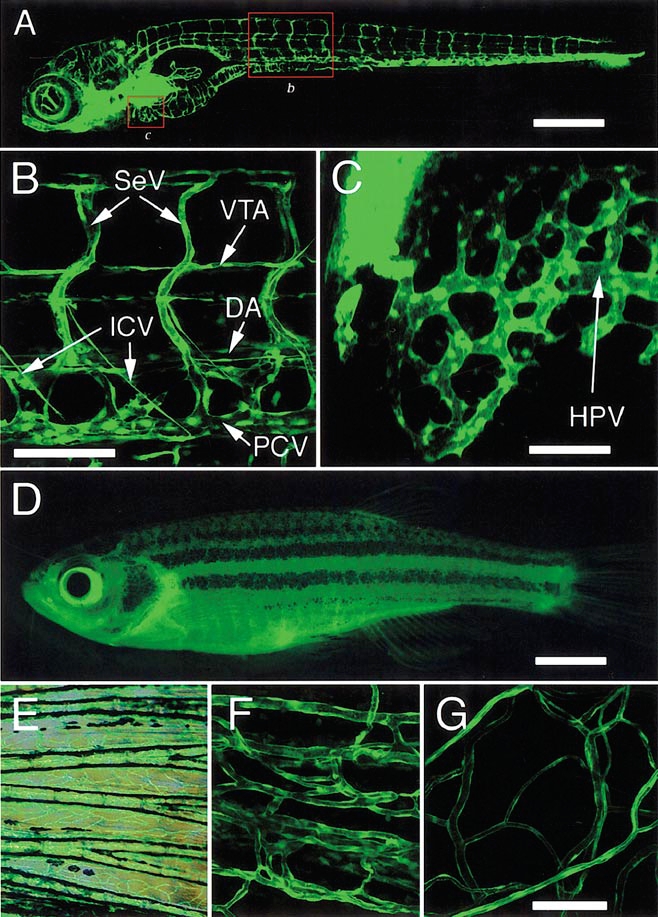
Fig. 4 EGFP expression in the vasculature of live TG(fli1:EGFP)y1; albb4 larvae and adults. (A–G) Lateral views, anterior to the left, dorsal is up. (B, C, F, G) Images acquired using multiphoton laser scanning microscopy. (A) A 7-dpf larva, compiled from five separate image reconstructions. Boxed areas labeled “b” and “c” indicate regions shown in (B) and (C), respectively; images in (A) and (B) are from two different larvae. (B) Image of trunk vessels at 7 dpf showing patent vessels such as the dorsal aorta (DA), posterior cardinal vein (PCV), segmental vessels (SeV), as well as vessels that do not carry blood flow at this time such as the vertebral arteries (VTA) and intercosta vessels (ICV). (C) Hepatic (liver) vasculature in a 5-dpf larva. The hepatic portal vein (HPV) is noted (arrow). (D) Full-length view of TG(fli1:EGFP)y1 adult fish. (E) Merged transmitted light and fluorescent image from the tail fin of the fish shown in (D). (F) Tail fin microvasculature in adult shown in (D). (G) EGFP-positive blood vessels associated with surface scales in adult shown in (D). Three-dimensional reconstructions of the images in (B), (C), (F), and (G) are available at http://zfish.nichd.nih.gov/zfatlas/fli-gfp/Fli_Home.html. Scale bar, (A) 500 μm; (B) 100 μm; (C) 50 μm; (D) 5 mm; (F, G) 100 μm.
Reprinted from Developmental Biology, 248(2), Lawson, N.D. and Weinstein, B.M., In vivo imaging of embryonic vascular development using transgenic zebrafish, 307-318, Copyright (2002) with permission from Elsevier. Full text @ Dev. Biol.