
|
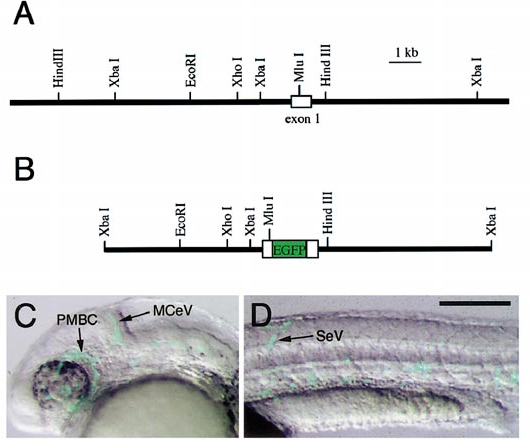
Fig. 1 Structure of fli1 5′ genomic region and injection construct. (A) Restriction map of the genomic region surrounding the first exon of zebrafish fli1. (B) Restriction map of the fli1 genomic fragment and EGFP transgene in the pfli15EGFP construct used for injection and establishment of transgenic lines. (C, D) Merged transmitted light and fluorescent images of live embryos injected with linearized pfli15EGFP at 26 hpf; lateral views, anterior is to the left, dorsal is up. (C) EGFP expression within the primordial midbrain channel (PBMC) and midcerebral vein (MCeV) in the head of an injected embryo. (D) EGFP expression in a segmental vessel (SeV). Scale bar, 200 μm.
Reprinted from Developmental Biology, 248(2), Lawson, N.D. and Weinstein, B.M., In vivo imaging of embryonic vascular development using transgenic zebrafish, 307-318, Copyright (2002) with permission from Elsevier. Full text @ Dev. Biol.