
|
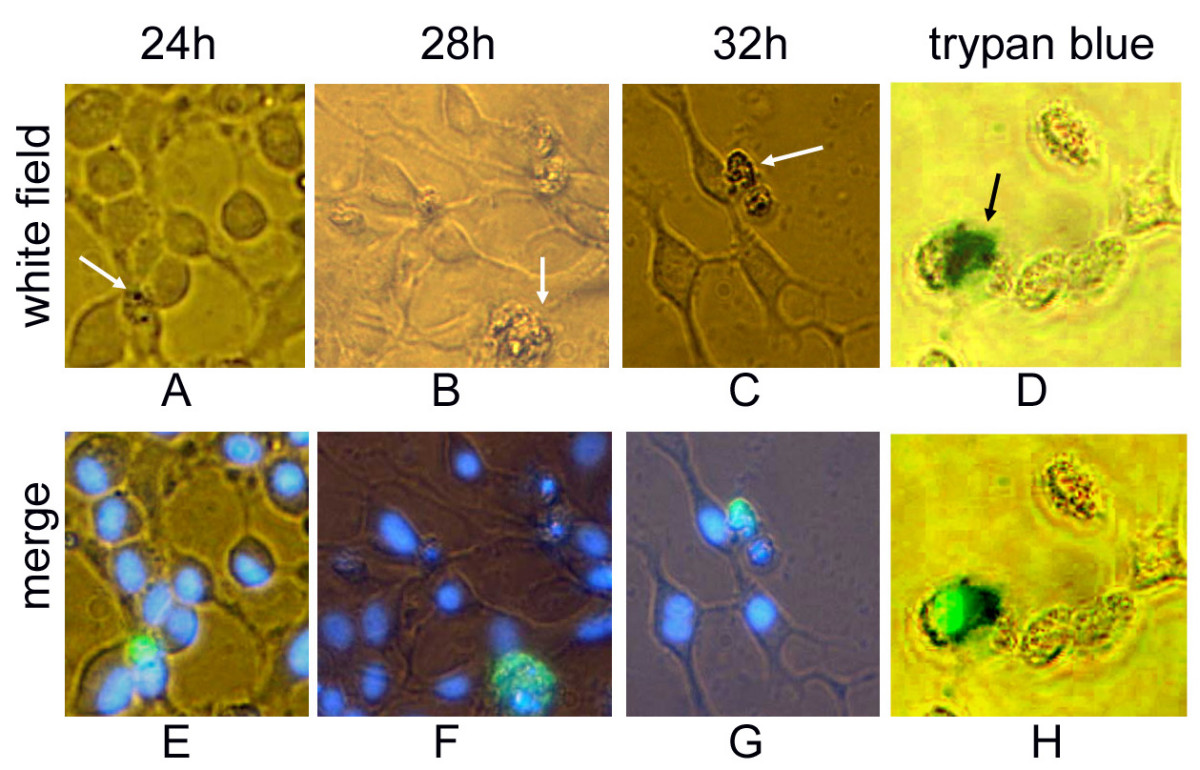
Fig. 6 Ectopic over-expression of K31 protein at different times after transfection. (A-C) the shapes of EPC cells taken in white field at 24 h, 28 h and 32 h after transfection by pEGFP-K31, respectively. The white arrows indicate the supposed dying cells. (E-G) the overlaps of the EGFP fluorescence and the cell nuclei stained by Hochest 33342 for A-C, respectively. (D, H) confirmation of the supposed dying cells using trypan blue dye; D is the shapes of EPC cells taken in white field at 32 h after transfection and stained by trypan blue; The black arrow indicate the dead cell. H is the overlaps of the EGFP fluorescence and the dead cell stained by trypan blue. Green, blue and dark blue signals represented GFP fluorescence, Hochest 33342 stained nuclei and trypan blue stained dead cell, respectively.