
Image
|
Figure Caption
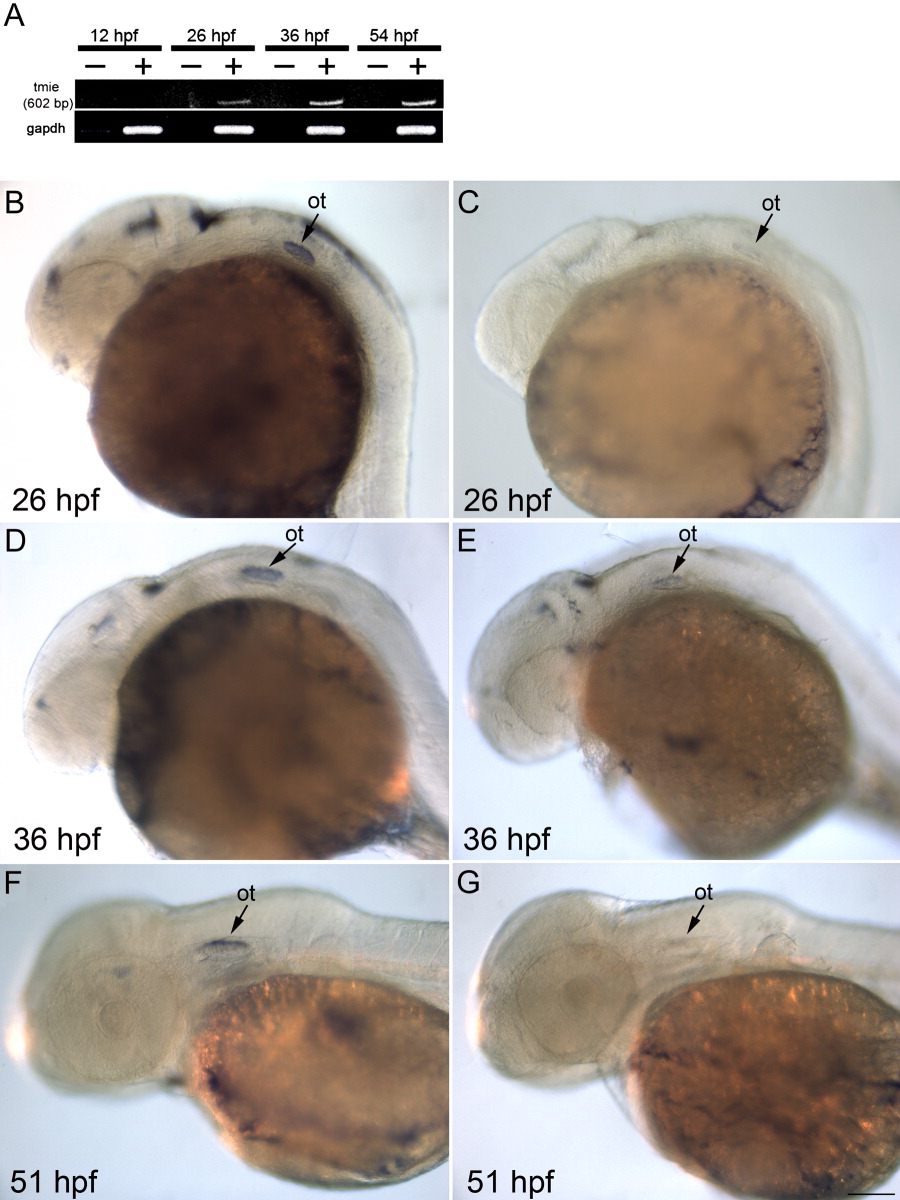
Fig. 2 Expression of tmie mRNA in the brain, and ear. A: RT-PCR results from various stages of embryonic development: -, no reverse transcriptase; +, with reverse transcriptase. B,C: Lateral view of 26-hpf embryos with tmie antisense probe (B) and sense probe (C). D,E: Lateral view of 36-hpf embryos with tmie antisense probe (D) and sense probe (E). F,G: Lateral view of 51-hpf embryos with tmie antisense probe (F) and sense probe (G). Signals were found in the developing otic vesicle at all stages observed. There is also staining in the brain. ot, otic vesicle; sc, spinal cord. Scale bar = 100 μm.
Figure Data
Acknowledgments
This image is the copyrighted work of the attributed author or publisher, and
ZFIN has permission only to display this image to its users.
Additional permissions should be obtained from the applicable author or publisher of the image.
Full text @ Dev. Dyn.