
|
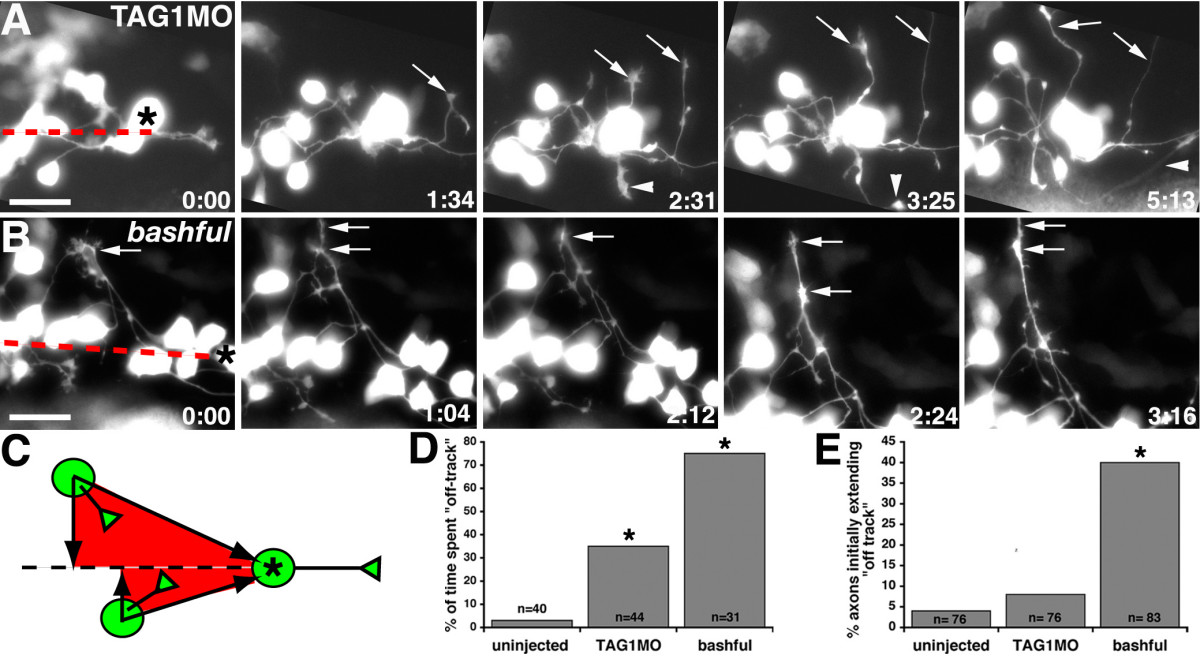
Fig. 4 TAG-1 or laminin-α1 loss of function causes misdirected MLF axon outgrowth.(a, b) Images from timelapse sequence of MLF axon outgrowth in TAG1MO injected (a) and bal;Tg(pitx2c:gfp) (b) embryos. Ventral views, anterior to the left, midline is up. Asterisks denote the caudal-most nucMLF cell. The dashed red line marks the nucMLF centerline. Arrows indicate MLF axons that wander into surrounding tissue and do not converge within timelapse duration. Arrowheads label an MLF axon that extends into lateral tissue, but eventually converges. The time stamp shows hours: minutes. (c) Schematic representation defining on-track (red shaded region) versus off-track regions. (d, e) Quantification of the average percentage of time MLF axons grew off-track (d) and the average percentage of axons that initially emerged from their cell body in an off-track position (e). *P < 0.001, two sample binomial comparison versus uninjected. N equals the number of MLF axons. Scale bar = 25 μm.