
|
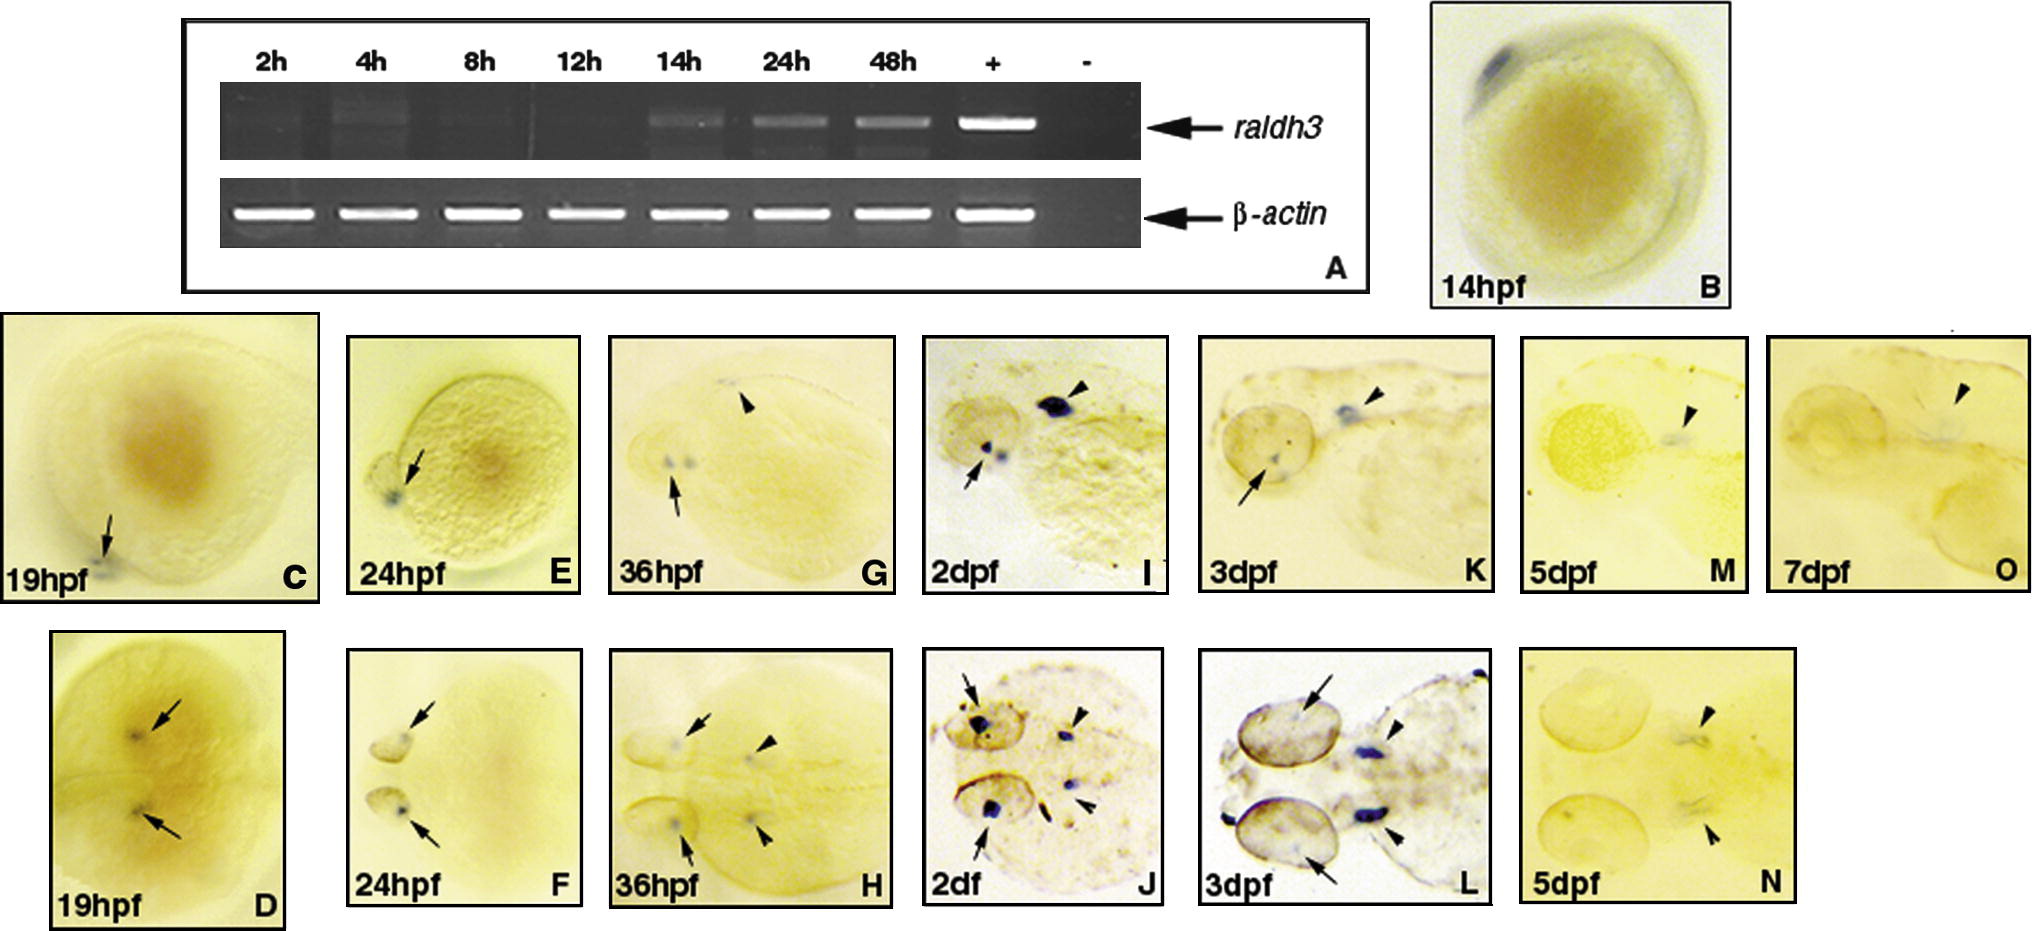
Fig. 3 Expression of raldh3 during early development of zebrafish. (A) RT-PCR analysis showing the expression of raldh3 gene. (2h–48h) Lanes using as templates total RNA isolated from 2 hpf–48 hpf embryos, respectively; +, positive control lane using raldh3 cDNA as template; -, negative control lane using water as template; PCR results give a 520 bp amplified fragment from raldh3 cDNA. Amplification of a 716 bp β-actin cDNA fragment is a control of RT-PCR sensitivity in the assay. (B–O) Whole mount in situ hybridization analysis showing the expression of raldh3 message. (B) Lateral view, anterior top; (C,E,G,I,K,M,O) lateral view, anterior left, dorsal top; (D,F,H,J,L,N) dorsal view, anterior left; arrow indicates the developing eye region or the ventral retina of eye and the arrow head does the otic vesicle. (B) 14 hpf; (C–D) 19 hpf; (E–F) 24 hpf; (G–H) 36 hpf; (I–J) 2 dpf; (K–L) 3 dpf; (M–N) 5 dpf; (O) 7 dpf.
Reprinted from Gene expression patterns : GEP, 8(4), Liang, D., Zhang, M., Bao, J., Zhang, L., Xu, X., Gao, X., and Zhao, Q, Expressions of Raldh3 and Raldh4 during zebrafish early development, 248-253, Copyright (2008) with permission from Elsevier. Full text @ Gene Expr. Patterns