
|
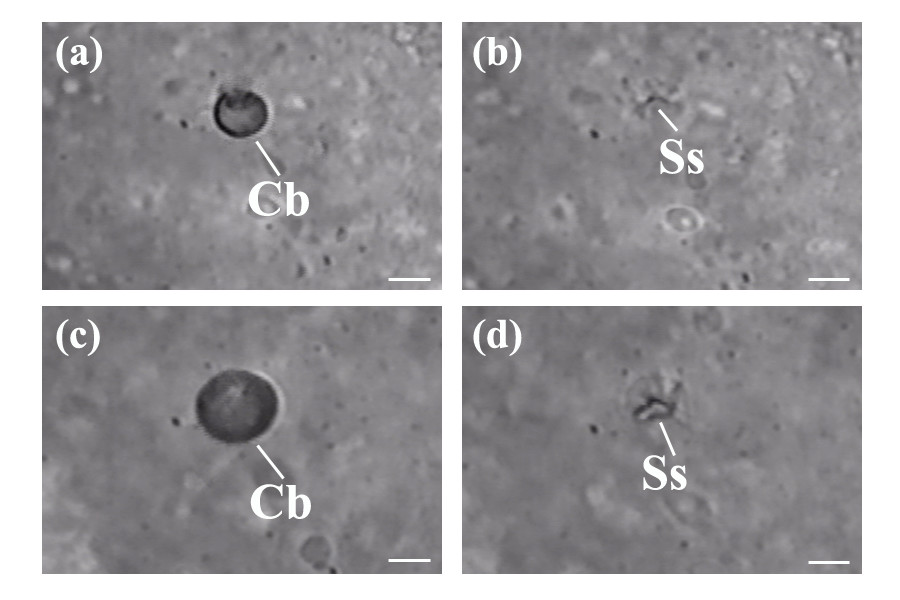
Fig. 7 (a, b, c, d) Depicts cavitation bubbles (Cb) and residual surface scarring (Ss) after the applied fs laser pulses. (a) Cavitation bubble (Cb) was produced using an average laser power of 45 mW with a beam dwell time of 100 ms and a single pulsing event of the galvo. The diameter of the cavitation bubble was measured to be ∼5 μm. (b) After pulsing the galvo a total of 3 times, surface scarring (Ss) of the blastomere was observed. The spatial extent of tissue scarring was measured to be ∼5 μm. (c) Depicts the cavitation bubble (Cb) created using an average laser power of 45 mW with a beam dwell time of 500 ms and a single pulsing event of the galvo. Diameter of the cavitation bubble was measured to be ∼10 μm. (d) After pulsing the galvo a total of 2 times, surface scarring (Ss) of the blastomere was observed. The spatial extent of tissue scarring was measured to be ∼10 μm. (a, b, c, d) Still images were extracted from additional file 1. Scale bars for (a, b, c, d) represent 5 μm.