
Image
|
Figure Caption
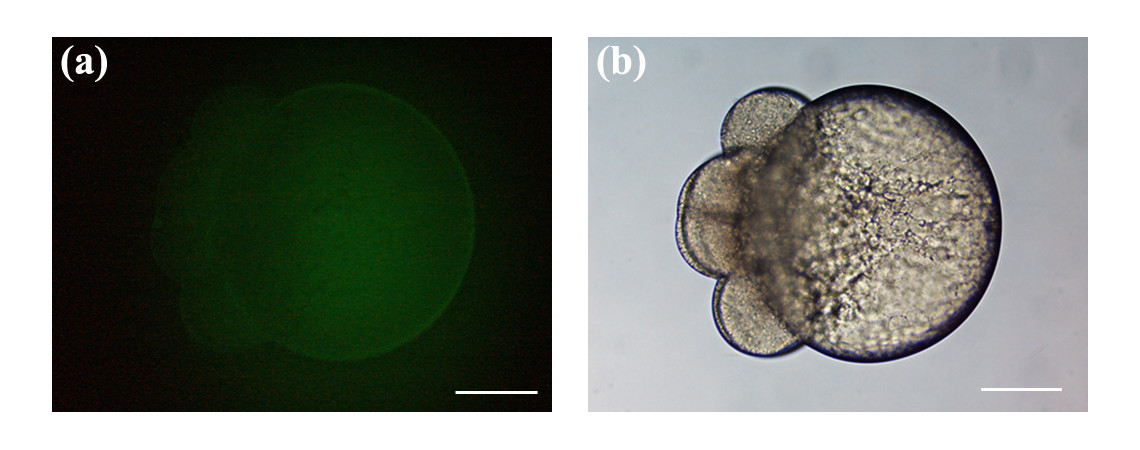
Fig. 6 (a, b) Fluorescence and brighfield image of an 8-cell stage embryo that was not laser-manipulated, but was bathed in a concentration of 0.014 to 0.018 mg/ml FITC-tank water for 10 to 15 min. The embryo was rinsed several times in fresh tank water and subsequently imaged with an imaging area and exposure time consistent with Figures 3, 4 and 5. No FITC dye was observed in the blastomere cells. (a) Weak autofluorescence was observed in the yolk. Scale bars for (a, b) represent 200 μm.
Acknowledgments
This image is the copyrighted work of the attributed author or publisher, and
ZFIN has permission only to display this image to its users.
Additional permissions should be obtained from the applicable author or publisher of the image.
Full text @ BMC Biotechnol.