
|
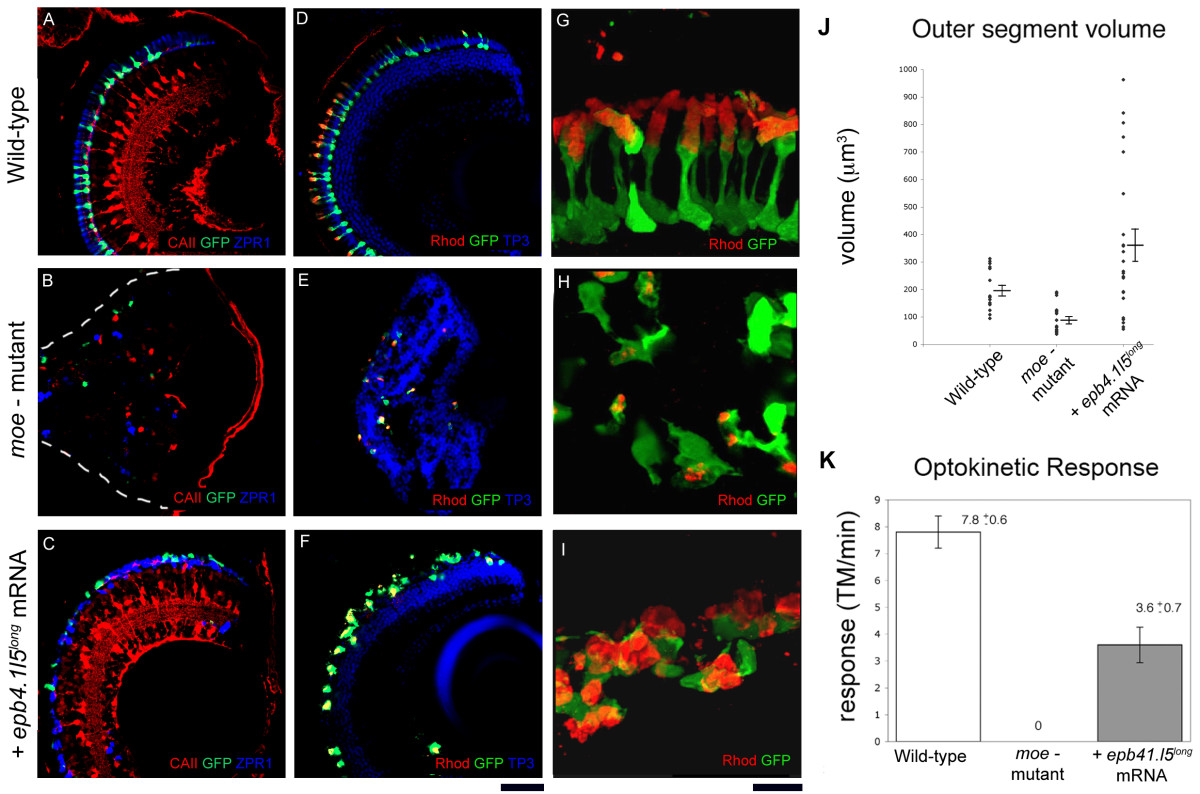
Fig. 5 Injection of epb4.1l5long mRNA into moe- mutants restores retinal lamination but not normal photoreceptor morphology at 6 dpf. In wild-type (A) and epb4.1l5long mRNA injected moe- mutants (C), Müller glial cells are radially oriented (labeled with anti-Carbonic Anhydrase II, red), and GFP+ rods and double cones (ZPR-1 antibody, blue) are adjacent to the RPE. (B) In moe- mutants, Müller glial cells (red), and rods (green) and double cones (blue) are fewer in number and are localized ectopically. White dashed line indicates the back of the eye. (D) In wild-type larvae, distinct nuclear layers (labeled by TO-Pro3, blue) are visible and outer segments labeled by anti-Rhodopsin (red) are aligned radially and project toward the RPE. (E) In moe- mutants, distinct nuclear layers are absent and rod morphology is abnormal. (F) In epb4.1l5long mRNA injected moe- mutants, distinct nuclear layers are visible but rod photoreceptor morphology is abnormal. (G, H, I) High magnification confocal z-projections of GFP+ rods labeled with anti-Rhodopsin (red) in wild-type (G), moe- mutant (H), and epb4.1l5long mRNA injected moe- mutant (I). (J) Outer segment volume at 6 dpf in wildtypes, moe- mutants, and epb4.1l5long mRNA injected moe- mutants. The average volume of rod outer segments in epb4.1l5long mRNA injected moe- mutants is 362 μm3 (+/- 57.1) which was significantly greater than the wild-type volume of 197 μm3 (+/- 18.5), p = 0.025. The volume of moe- rod outer segments was 90.9 μm3 (+/- 12.3), significantly smaller than wild-type rods (p < 0.001). Significance was determined using the Students T-test. (K) Optokinetic response was measured at 5 dpf in wild-types, moe- mutants and epb4.1l5long mRNA injected moe- mutants. Wild-type larvae exhibited an average of 7.8 (+/- 0.6) tracked movements (TM)/minute, epb4.1l5long mRNA injected moe- mutants exhibited a reduced OKR (3.6 (+/- 0.7) TM/minute). moe- mutants exhibited no OKR. N = 10 for each group. Scale bars, 40 μm (A-F), 10 μm (G-I). (A-F, single confocal z-sections, G-I, z-projections).