
|
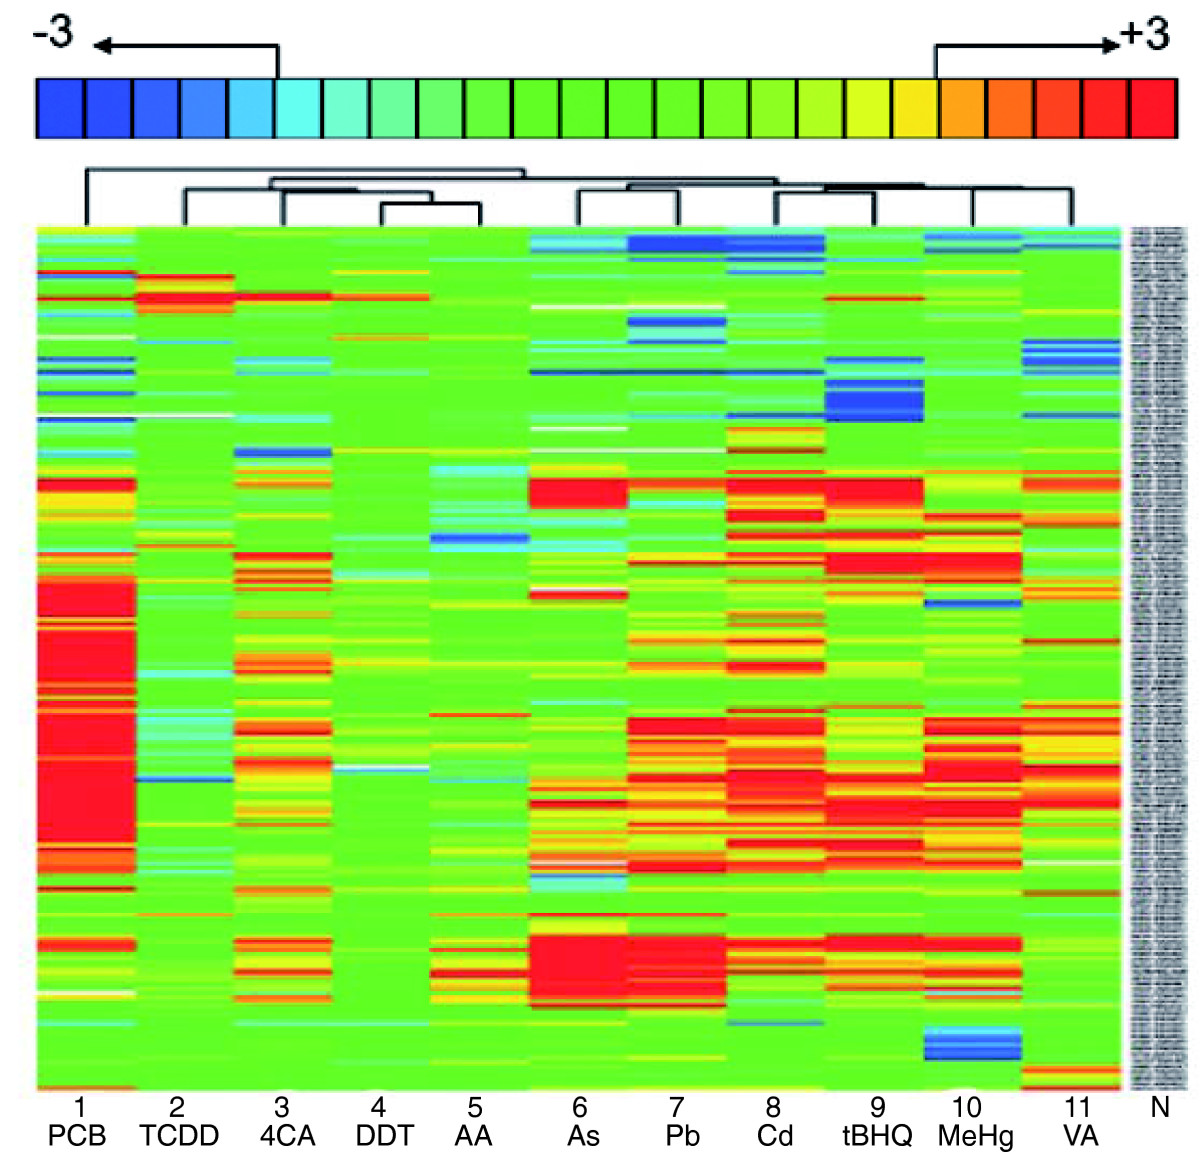
Fig. 3 Toxicants induce highly specific toxicogenomic profiles. Hierarchical clustering of gene responses in embryos treated between 96 and 120 hpf with PCB (33 mg/l), TCDD (500 ng/l), 4CA (50 mg/l), DDT (15 mg/l), AA (71 mg/l), As (79 mg/l), Pb (2.8 mg/l), Cd (5 mg/l), tBHQ (1.7 mg/l), MeHg (60 μg/l), VA (50 mg/l). For each toxicant exposure, vehicle controls were carried out in parallel. The gene names are indicated (N) and are legible upon magnification of the PDF version of this figure. The key at the top indicates the color code for fold changes ranging from threefold upregulated (+3, red) to threefold downregulated (-3, blue). Fold changes greater than three are not indicated explicitly but are included. Only genes are listed whose mRNA levels changed by more than twofold (padj < 0.025) in at least one of the treatments. The data represent the average over all biological and technical repeats (see Table 1).