
Fig. 3
- ID
- ZDB-IMAGE-080325-35
- Genes
- Publication
- Ke et al., 2008 - Combined activity of the two Gli2 genes of zebrafish play a major role in Hedgehog signaling during zebrafish neurodevelopment
- All Figures
- Figures for Ke et al., 2008
|
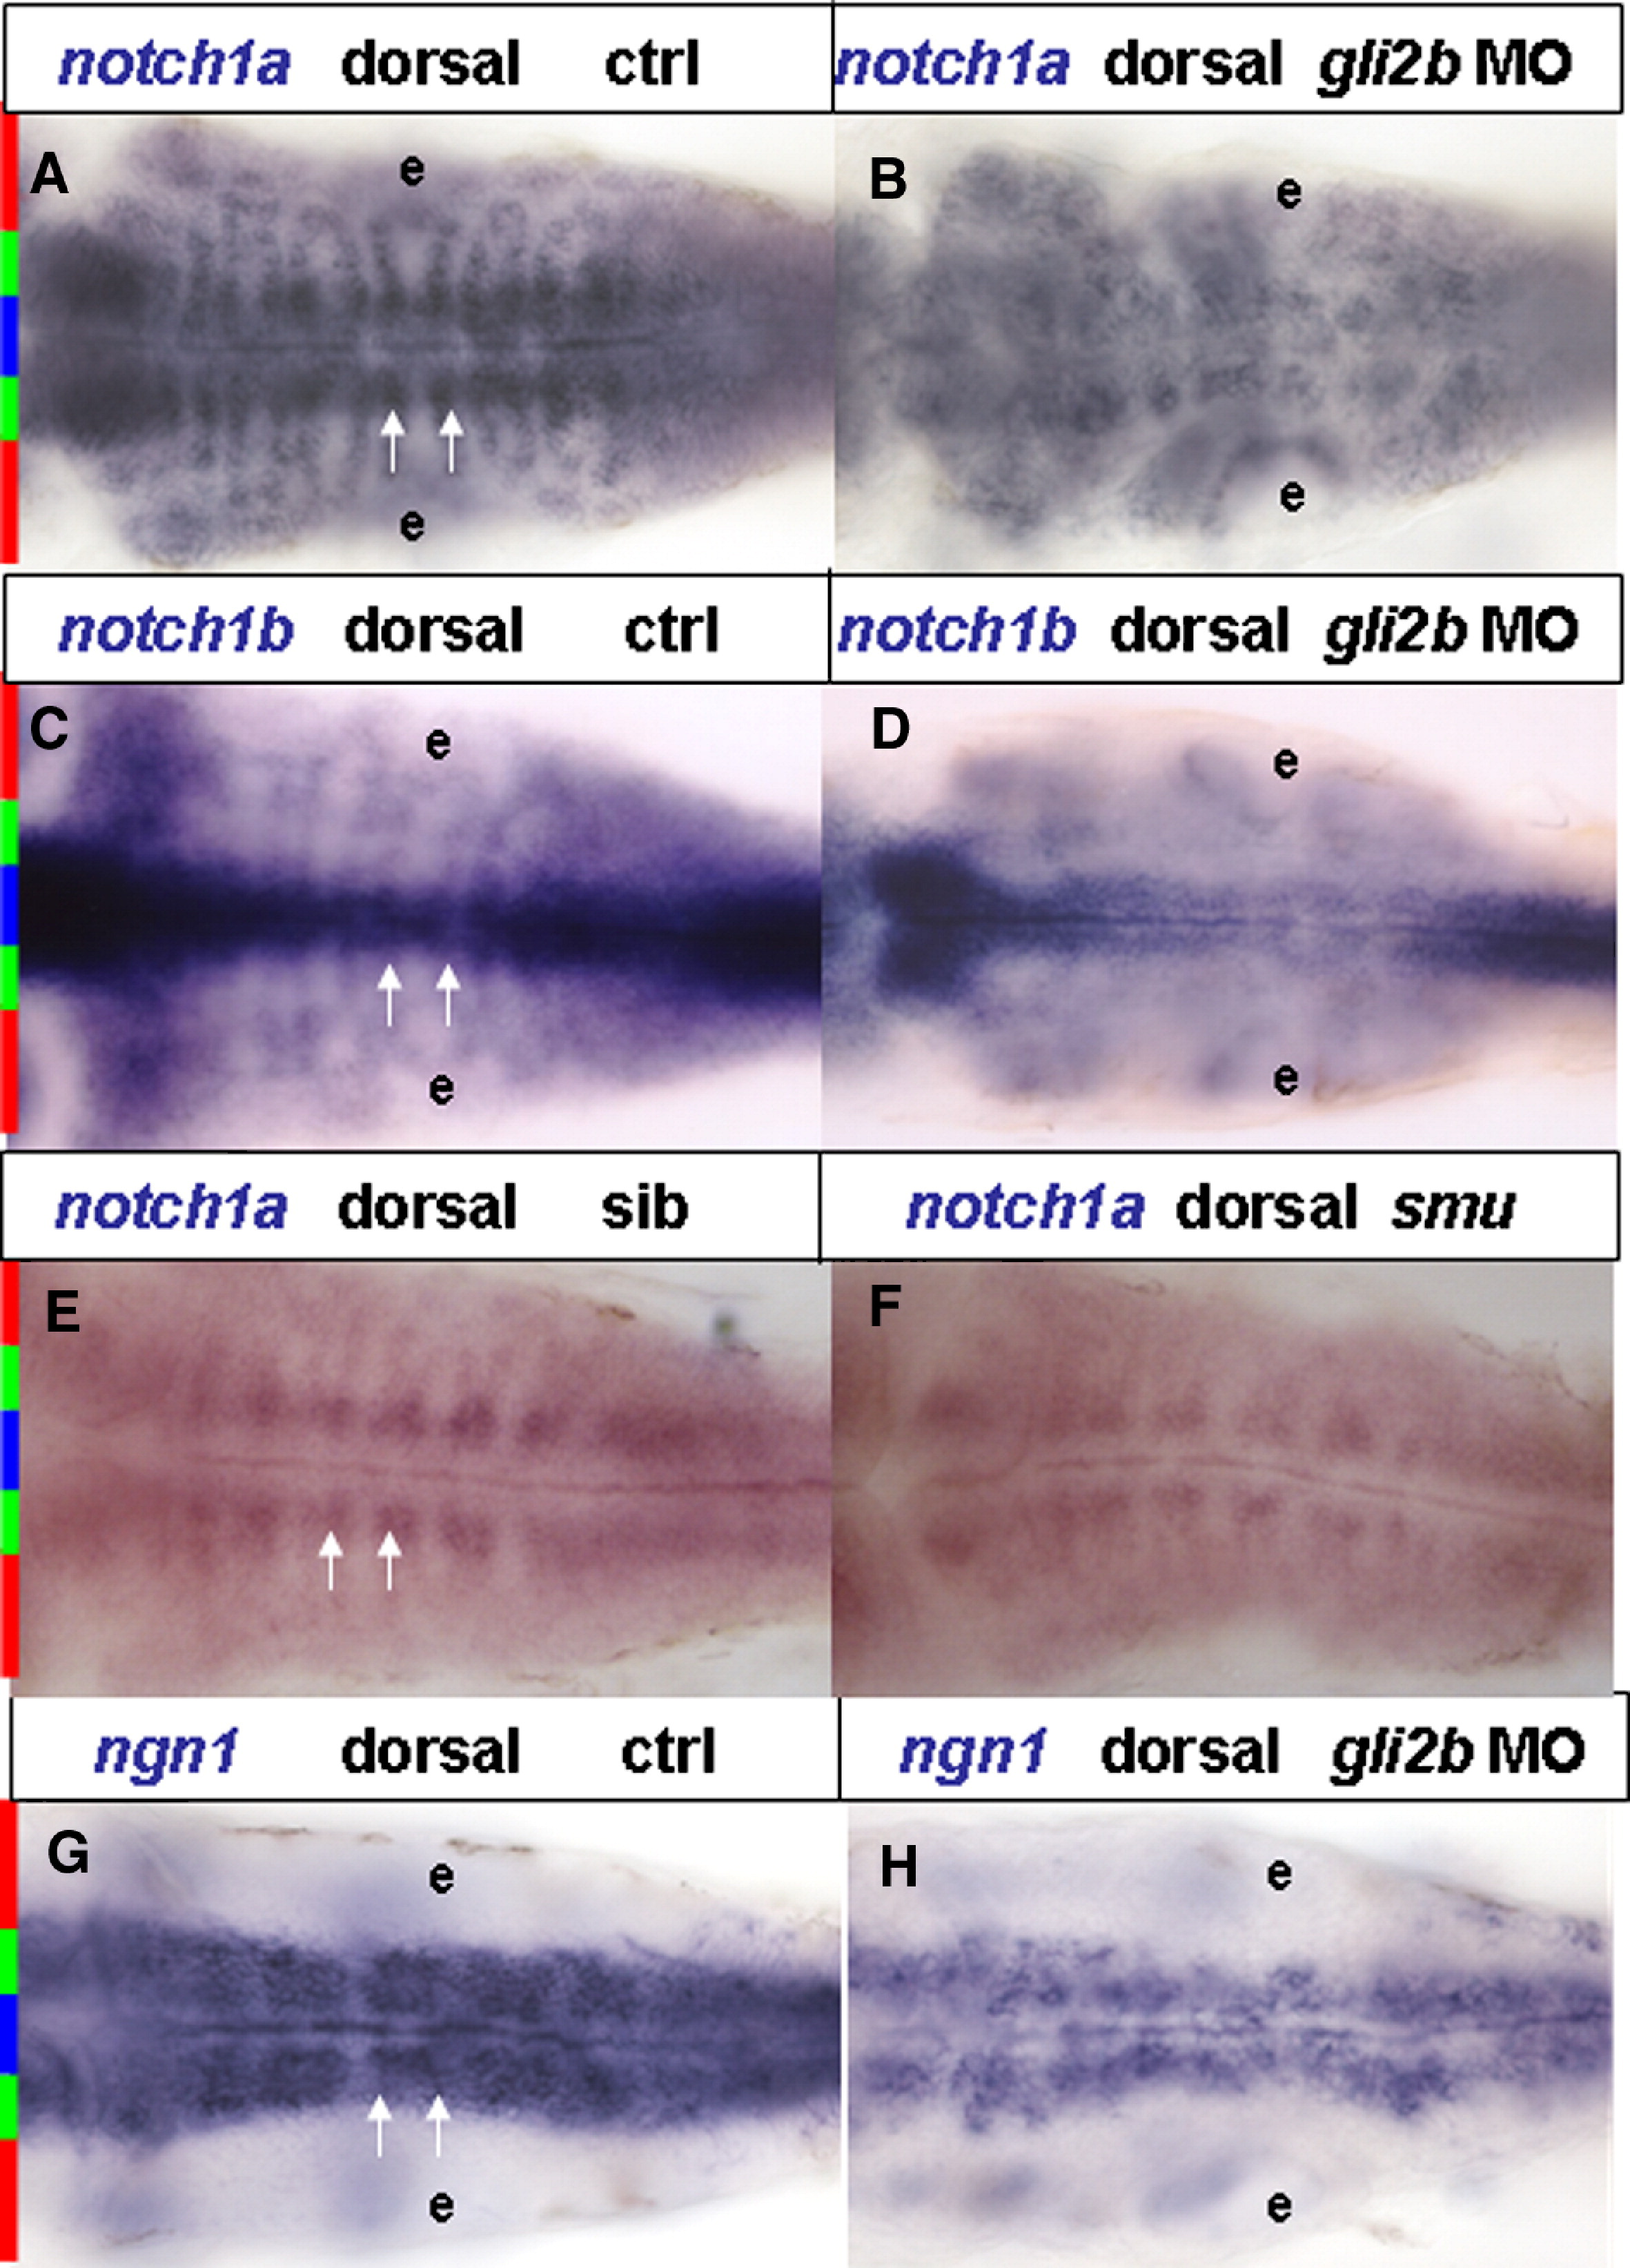
Fig. 3 Expression of early neurodifferentiation markers in the hindbrain of Gli2b morphant. (A, B) notch1a in Gli2b morphant (A) and control (B). (C, D) notch1b in Gli2b morphant (C) and control (D). (E, F) notch1a in a sibling (E) and smu mutant (F). (G, H) ngn1 in Gli2b morphant (G) and control (H). White arrows that indicate distance between medio-lateral clusters (A, E) encompass the whole domain of ngn1 expression (G). The relative positions of expression domains are indicated in left side of the panel: midline, blue bar; intermediate medio-lateral cluster, green bar; lateral loops; red bar. Abbreviations: e, ear.
Reprinted from Molecular and cellular neurosciences, 37(2), Ke, Z., Kondrichin, I., Gong, Z., and Korzh, V., Combined activity of the two Gli2 genes of zebrafish play a major role in Hedgehog signaling during zebrafish neurodevelopment, 388-401, Copyright (2008) with permission from Elsevier. Full text @ Mol. Cell Neurosci.